- May 1, 2024
- Posted by: capadmin
- Category: Market News
EUR/USD Bearish Trend Deepens on H4 Chart
The BTC/USD pair, a major indicator of Bitcoin’s market movements against the US dollar, reveals current trends and potential future movements within the H4 timeframe. This analysis utilizes Ichimoku Cloud and Relative Strength Index (RSI) indicators to provide insights into the cryptocurrency’s price dynamics
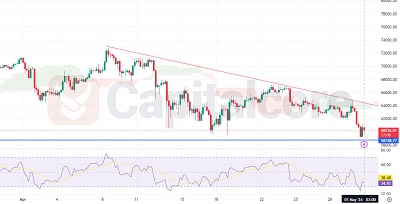
Chart Notes:
• Chart time-zone is UTC (+03:00)
• Candles’ time-frame is 4h.
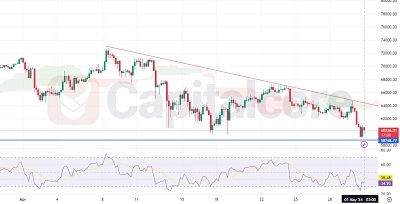
On the H4 chart for BTC/USD, the price shows a pronounced downtrend, emphasized by a significant red candlestick that has pushed the price below the $60,000 mark. The descending trendline from previous highs suggests sustained selling pressure. Additionally, the price is currently below the Ichimoku Cloud, indicating a bearish outlook as the cloud acts as a resistance zone. The RSI, positioned below 40, leans towards the oversold territory but mainly reflects strong bearish momentum without immediate signs of reversal.
The intersection of these technical elements—the trendline, Ichimoku Cloud, and RSI—suggests that the bearish sentiment is robust. Traders might anticipate further declines unless there’s a clear break above the trendline and the cloud, which could signal a potential shift in market dynamics. Investors should watch for any movements indicating a weakening of the current bearish trend or a consolidation phase that might precede a trend reversal.
• DISCLAIMER: Please note that the above analysis is not an investment suggestion by “Capitalcore Ltd”. This post has been published only for educational purposes.