- September 25, 2023
- Posted by: capadmin
- Category: Market News
USDNZD 4-hour Chart: A Comprehensive Bullish Breakdown
The USDNZD pair on its 4-hour chart exhibits distinct signs pointing toward an emerging bullish momentum. Leveraging insights from key technical indicators, such as the SMA and MACD, a comprehensive understanding of the pair’s current trajectory becomes evident. Let’s delve deeper into these indicators for a more detailed analysis.
Chart Notes:
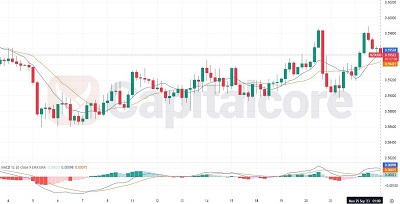
• Chart time-zone is UTC (+03:00)
• Candles’ time-frame is 4h.
In the 4-hour chart of USDNZD, there are clear signs of bullish momentum. The short-term Simple Moving Average (SMA) has crossed above the long-term SMA, indicating a potential upward trend. Further affirming the bullish outlook is the Moving Average Convergence Divergence (MACD) line which, at 0.00098, has recently crossed above its signal line, positioned at 0.00075. This crossover is a classic bullish signal. Additionally, the MACD histogram, reading at 0.00023 above the baseline, confirms the momentum with the buyers, since it illustrates the increasing distance between the MACD line and its signal line. All these technical indicators collectively project a bullish stance for USDNZD in the near term, suggesting traders might look for opportunities to go long.
• DISCLAIMER: Please note that the above analysis is not an investment suggestion by “Capitalcore Ltd”. This post has been published only for educational purposes.