- October 13, 2023
- Posted by: capadmin
- Category: Market News
BTC/USD 4-Hour Analysis: Bearish Signals Emerge
The BTC/USD pairing on the 4-hour chart provides insightful indicators of its recent performance trends. As we delve into the technical aspects, there are clear signs of bearish momentum that traders should consider in their strategies.
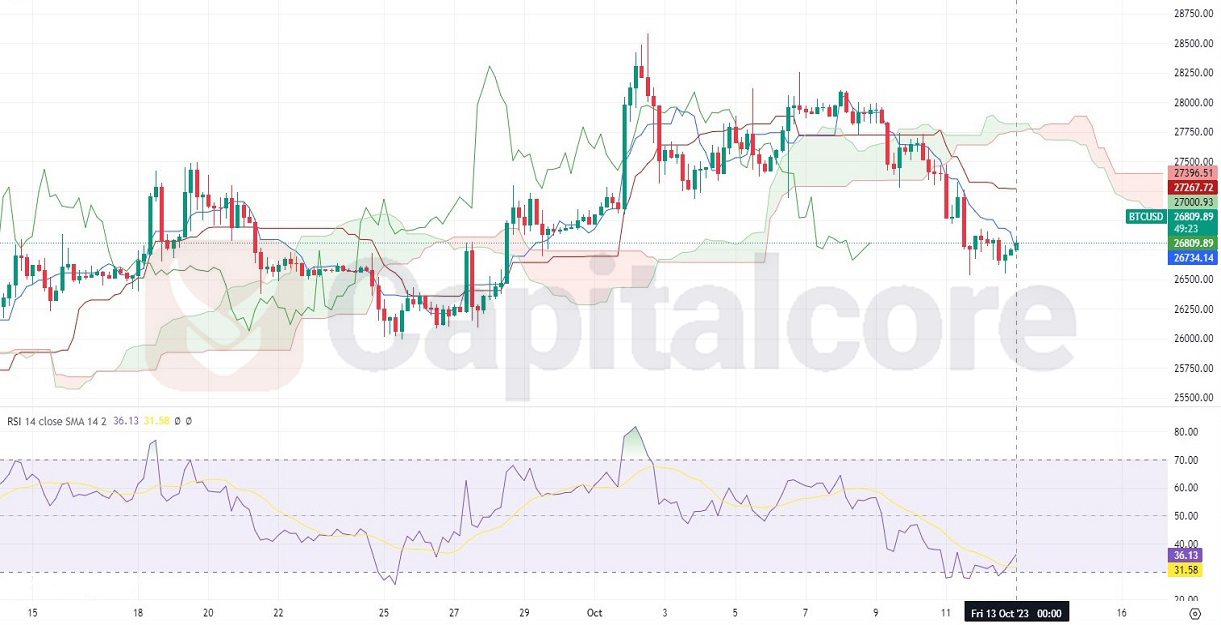
Chart Notes:
• Chart time-zone is UTC (+03:00)
• Candles’ time-frame is 4h.
On this BTC/USD 4-hour chart, there is a noticeable trend of bearish momentum. The Relative Strength Index (RSI) is lingering below the mid-line at approximately 31.58, signaling potential oversold conditions, but not significantly divergent to suggest an immediate reversal. The Ichimoku cloud turns bearish, with the price consistently trading below the cloud. Recent candles have closed below the Tenkan-sen (green line), indicating selling pressure. The sharp decline witnessed around October 1st seems to be stabilizing, but there’s no clear indication of a bullish reversal yet. Key support appears to be around the 26,730 marks. To confirm a potential bullish trend, traders might look for a price breakout above the cloud and a bullish crossover in the RSI. Until then, caution is advised.
• DISCLAIMER: Please note that the above analysis is not an investment suggestion by “Capitalcore Ltd”. This post has been published only for educational purposes.