- October 24, 2023
- Posted by: capadmin
- Category: Market News
Understanding the Upward Momentum
The BTC price chart presented paints a vivid picture of the cryptocurrency’s performance over a specific timeframe. At a glance, one can immediately observe a pronounced bullish momentum. This bullish trajectory is all the more evident when you consider how the price has soared, firmly positioning itself above the boundaries of the Ichimoku cloud. In the realm of technical analysis, such a stance above the Ichimoku cloud often signals a robust bullish trend. Furthermore, a historical examination reveals that the price trajectory seems to have displayed a respectable adherence to the lower boundaries of the Ichimoku cloud. This consistent behavior strengthens the argument in favor of the prevailing upward momentum.
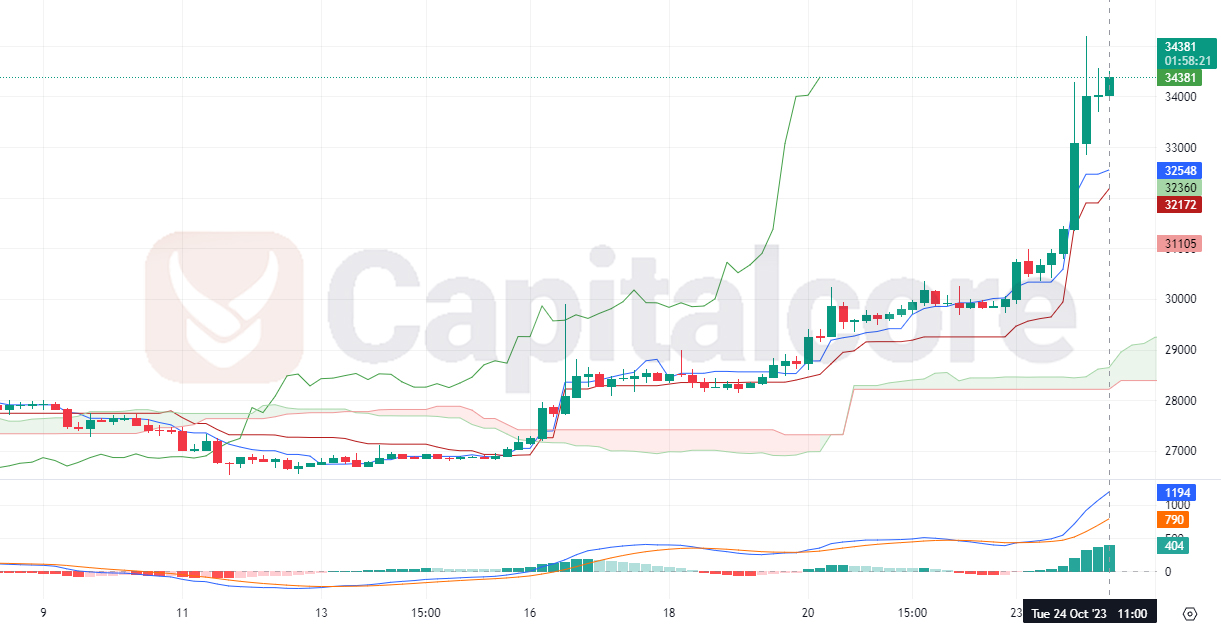
Chart Notes:
• Chart time-zone is UTC (+03:00)
• Candles’ time-frame is 4h.
Delving deeper into the technical indicators, the Moving Average Convergence Divergence (MACD) offers valuable insights. This revered tool illustrates a potent bullish sentiment. To be more specific, the MACD line is not just above the signal line, but the gap between them is quite substantial, which is often interpreted as a sign of strong bullish momentum. Additionally, it’s worth noting that both the MACD line and its counterpart, the signal line, reside comfortably in the positive territory. This positioning is indicative of a strong bullish momentum that has been sustained over the recent period.
Taking a more comprehensive look at the BTC chart, the vast divergence between the MACD line and its signal line is undeniably striking. Such a significant gap typically suggests that the ongoing upward momentum isn’t just a fleeting phase but possesses robust strength that could very well persist in the immediate future. Complementing this observation is the fact that the BTC price comfortably hovers above the Ichimoku cloud, further consolidating its bullish stance.
To summarize, the visual representation of BTC’s performance, as depicted in the provided chart, clearly echoes strong bullish sentiments. The synchronized harmony between the MACD and Ichimoku cloud indicators bolsters this bullish narrative. However, it remains paramount for traders and investors to exercise caution. They should be on the lookout for potential reversals or periods of consolidation, especially if the BTC price starts flirting with known resistance levels or if any discernible shifts in the overarching market sentiment emerge. In trading and investing, it’s always prudent to leverage insights from multiple technical indicators and to stay abreast of global market events. By adopting such a comprehensive approach, one can attain a holistic view of the market, ensuring more informed and strategic trading decisions.
• DISCLAIMER: Please note that the above analysis is not an investment suggestion by “Capitalcore Ltd”. This post has been published only for educational purposes.