- November 23, 2023
- Posted by: capadmin
- Category: Market News
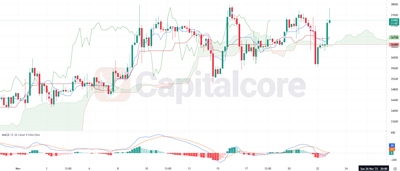
BTCUSD Bearish Momentum Intensifies Further
The BTCUSD chart exhibits a bearish trend with the price action moving below the Ichimoku cloud, indicating a potential continuation of the downtrend. Recently, a bearish crossover within the Moving Average Convergence Divergence (MACD) is observed, where the signal line crosses above the MACD line, reinforcing the downward momentum. The histogram also depicts increasing bearish momentum as it moves below the baseline. The trading volume appears to be inconsistent, failing to provide a strong confirmation of the prevailing trend.

Chart Notes:
• Chart time-zone is UTC (+03:00)
• Candles’ time-frame is 4h.
Analyzing the Ichimoku Kinko Hyo components, the price has dipped below the Kijun-sen (baseline), which acts as a key indicator of medium-term momentum and is now facing resistance from the Tenkan-sen (turning line). The widening spread between the Senkou Span A and B, which forms the cloud, could suggest that volatility is increasing, often a precursor to a trend continuation or reversal. The MACD’s declining bars below the zero line indicate strong bearish pressure. It’s essential to watch for any potential bullish MACD crossover or a price move above the cloud as signals of a trend reversal. In the short term, traders might consider the lower bound of the cloud as a dynamic support level, with a break below signaling further declines. Long-term investors should await clearer bullish signals before considering entry.
• DISCLAIMER: Please note that the above analysis is not an investment suggestion by “Capitalcore Ltd”. This post has been published only for educational purposes.