- July 17, 2023
- Posted by: Lewis Miller
- Category: Market News

Bearish Reversal: MA Descending, MACD Histogram Down
In analyzing the BTCUSD pair using Moving Averages (MA) and Average Directional Movement Index (AMCD) indicators, three key observations can be made. Firstly, the MA was moving above the candles, indicating a bullish trend. However, it is now descending and currently positioned over the candles, suggesting a potential reversal or consolidation. Secondly, the AMCD indicator can provide further insight into the market sentiment and potential shifts in momentum.
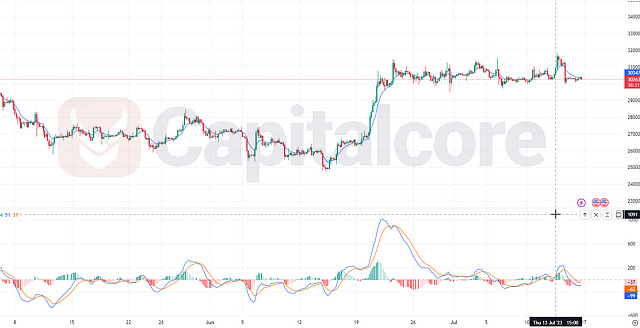
Chart Notes:
• Chart time-zone is UTC (+03:00)
• Candles’ time-frame is 4h.
In analyzing the BTCUSD pair using Moving Average (MA) and Moving Average Convergence Divergence (MACD) indicators, the following observations can be made. Firstly, the MA was initially moving above the candles, indicating a bullish trend. However, it is now descending and positioned over the candles, suggesting a potential reversal or consolidation. Secondly, in the MACD indicator, both the signal line and MACD line are cutting the histogram toward the downside, signaling a bearish momentum. Notably, the signal line remains above the MACD line, indicating a possibility of further downward pressure in the BTCUSD pair.
• DISCLAIMER: Please note that the above analysis is not an investment suggestion by “Capitalcore Ltd”. This post has been published only for educational purposes.