- May 9, 2024
- Posted by: capadmin
- Category: Market News
Fibonacci and MACD: BTCUSD Trading Outlook
Bitcoin (BTC), a major player in the cryptocurrency market, has continuously attracted attention due to its volatility and significant market impact. BTC operates on a decentralized blockchain system, ensuring secure and transparent transactions. This makes BTC/USD technical analysis crucial for traders who aim to exploit its market movements for potential gains..
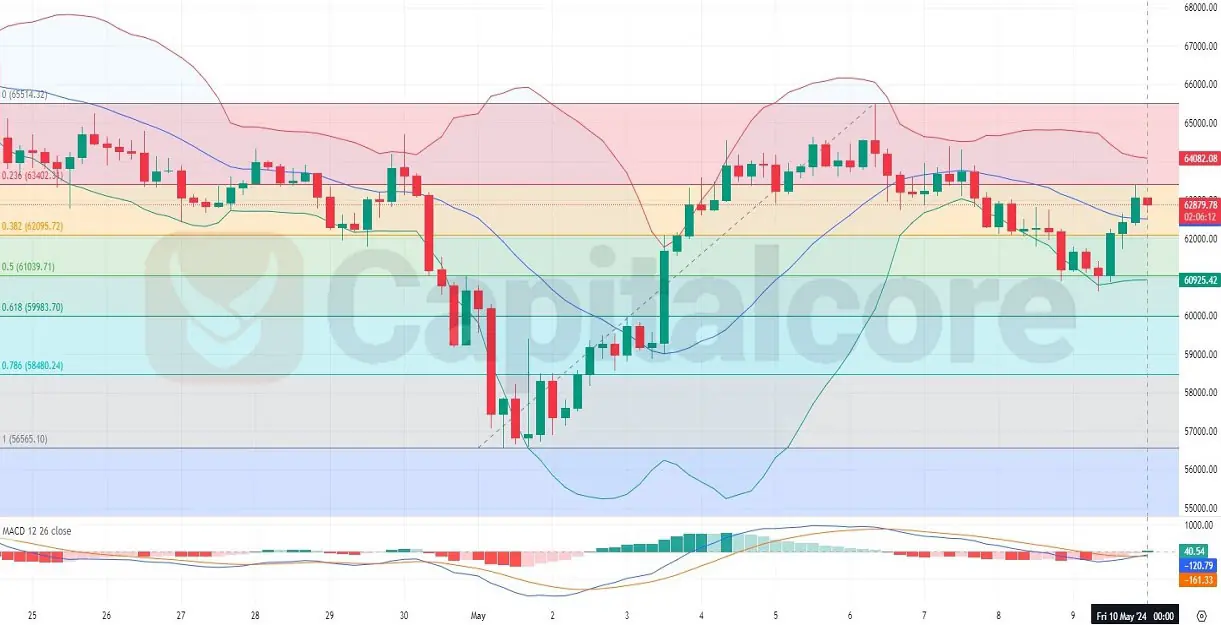
Chart Notes:
• Chart time-zone is UTC (+03:00)
• Candles’ time-frame is 4h.
In the provided BTCUSD daily chart analysis, several indicators give insight into Bitcoin’s price behavior. The Bollinger Bands show a noticeable increase in volatility at the beginning of May, as the bands expand significantly, followed by a contraction indicating a possible period of consolidation or decreased volatility in the BTC-USD exchange. The Fibonacci retracement levels highlight the $60,000 area, marked by the 0.618 level, as a robust support zone where the price has shown resilience and rebounding tendencies.
The MACD indicator in the BTC USD price analysis shows a crossover of the signal line, suggesting a potential bullish reversal after a period of decline. This is further corroborated by a recent upward move in price candles, which align closely with the BTC/USD technical analysis today. Overall, these technical elements provide a comprehensive view of current market conditions and potential future movements of Bitcoin.
• DISCLAIMER: Please note that the above analysis is not an investment suggestion by “Capitalcore Ltd”. This post has been published only for educational purposes.