- October 29, 2024
- Posted By: james w
- Category: Market News
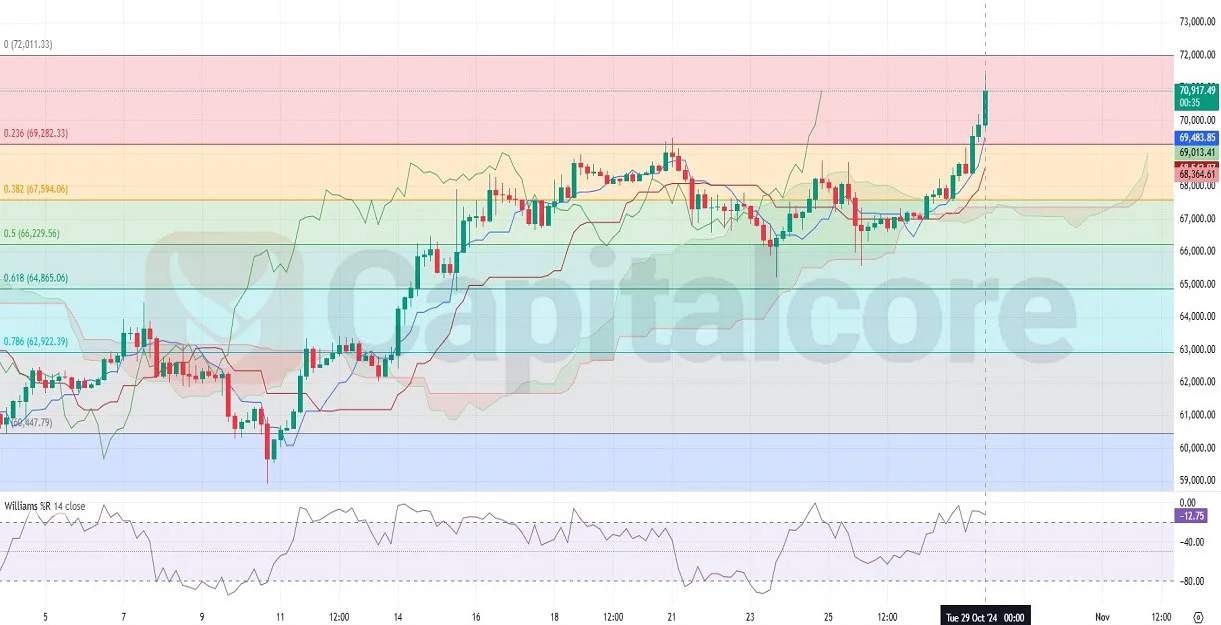
Williams %R Indicates BTCUSD Overbought Signal
BTCUSD pair, often referred to as “Digital Gold,” represents the exchange rate of Bitcoin in US Dollars, merging the volatility of cryptocurrency with forex trading. Today’s key economic indicators from the US include updates on the Trade Balance, Wholesale Inventory, House Price Index, and Consumer Confidence—each of which could influence the dollar’s strength. With a stronger dollar potentially putting downward pressure on BTC/USD, any weakness in these indicators might support further upside movement. A particularly close eye will be on the Conference Board’s Consumer Confidence report and JOLTS job openings, as these provide insight into economic resilience and consumer spending—both critical for the dollar’s trajectory.

Chart Notes:
• Chart time-zone is UTC (+03:00)
• Candles’ time-frame is 4h.
On the BTCUSD H4 chart, we observe a sharp bullish trend within the last 20 candles, with a strong rally beginning at this week’s market opening. Out of these candles, 14 have been bullish, reflecting a persistent upward momentum that has pushed BTC USD above the Ichimoku cloud—a signal of a robust trend. The BTC-USD pair has also breached key Fibonacci levels, including the 0.5 and 0.382, currently sitting between the 0.236 level and resistance around 72,011. The Williams %R indicator, while near the overbought region, suggests sustained bullish sentiment but warrants caution for potential corrections. BTCUSD’s ability to sustain above the cloud and hold gains at higher Fibonacci levels will likely determine the strength of this bullish move.
• DISCLAIMER: Please note that the above analysis is not an investment suggestion by “Capitalcore LLC”. This post has been published only for educational purposes.