- March 18, 2024
- Posted by: capadmin
- Category: Market News
MACD Hints at Bitcoin’s Next Move
In the ever-evolving landscape of cryptocurrency, BTCUSD presents a new picture in its market behavior. The following analysis delves into the recent patterns and indicators to forecast potential movements. Observations are based on the H4 timeframe, providing a granular look at Bitcoin’s performance against the US dollar.
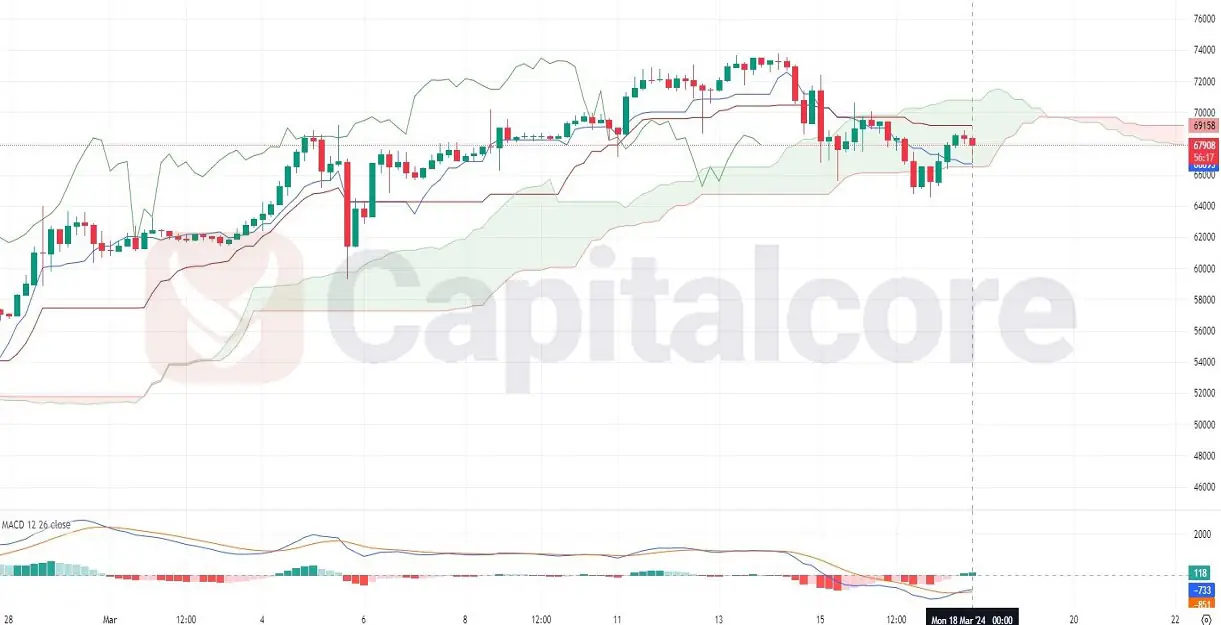
Chart Notes:
• Chart time-zone is UTC (+03:00)
• Candles’ time-frame is 4h.
BTCUSD on the H4 chart shows a significant interplay between bullish and bearish momentum. The price currently hovers near the Ichimoku cloud, suggesting a potential indecision in the market. The MACD indicates a bullish crossover is in progress, with the histogram moving towards the positive territory, which could signal the start of an upward trend. However, the recent price action remains below the cloud, and a definitive upward movement would require a sustained break above this zone. The Bollinger Bands show a contraction, typically preceding a volatility breakout. Traders will be watching the upper Bollinger Band for resistance and the lower for potential support, as BTCUSD seeks direction in a cautious market.
• DISCLAIMER: Please note that the above analysis is not an investment suggestion by “Capitalcore Ltd”. This post has been published only for educational purposes.