- January 26, 2024
- Posted by: capadmin
- Category: Market News
Bitcoin’s Price Action Suggests Downtrend Continuation
BTCUSD, representing the Bitcoin to US Dollar exchange rate, is a highly volatile pair that offers insights into investor sentiment towards digital currencies. The following technical analysis provides a snapshot of Bitcoin’s market activity and potential future movements.

Chart Notes:
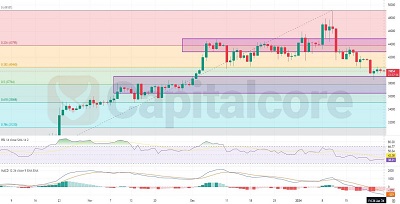
• Chart time-zone is UTC (+03:00)
• Candles’ time-frame is 4h.
The BTCUSD H4 chart indicates a bearish trend with the price recently breaking below a significant support level. The Fibonacci retracement levels drawn from the swing low to the high show the price hovering just above the 0.618 level, which is often considered a potential reversal zone. The RSI is trending downwards and has crossed below the 50 mark, suggesting increasing bearish momentum. The MACD histogram is below the signal line and descending further into negative territory, reinforcing the bearish outlook. Additionally, the recent candles have closed below the key psychological level of $40,000, which could now act as resistance on any retrace. The consolidation box highlighted in the chart suggests a potential distribution phase before the recent sell-off, signaling that buyers were unable to sustain higher prices.
• DISCLAIMER: Please note that the above analysis is not an investment suggestion by “Capitalcore Ltd”. This post has been published only for educational purposes.