- May 2, 2024
- Posted by: capadmin
- Category: Market News

Bearish Signals in Bitcoin’s Market Analysis
Bitcoin (BTCUSD) represents the value of Bitcoin in terms of the US Dollar, and is a crucial indicator of Bitcoin’s market health and broader acceptance in financial portfolios. This cryptocurrency is influenced by factors such as regulatory news, technological advancements, market sentiment, and macroeconomic trends. As digital assets become more integrated into mainstream finance, understanding the technical aspects of BTCUSD trading becomes essential for both investors and traders.
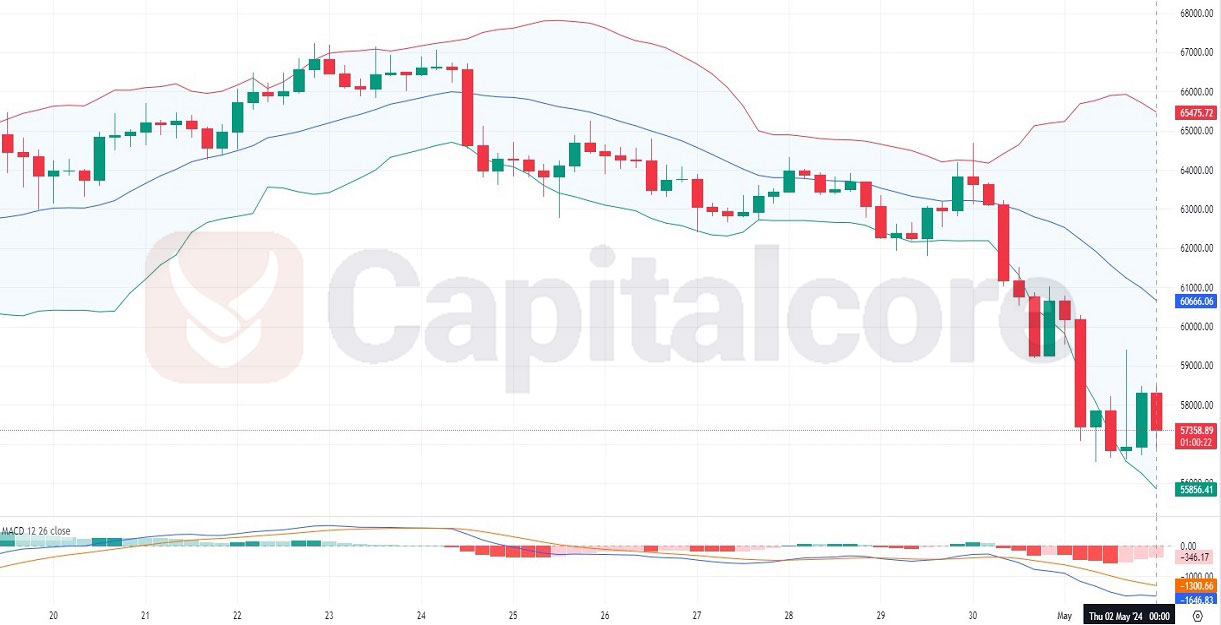
Chart Notes:
• Chart time-zone is UTC (+03:00)
• Candles’ time-frame is 4h.
In the given BTCUSD chart with a time frame of H4, the price action is currently below the middle Bollinger Band, indicating a potential downtrend. The widening of the bands from around May 28 to May 30 suggests increasing volatility, with a significant price drop beneath the lower band showing strong bearish momentum. The MACD confirms this bearish sentiment, as the MACD line is below the signal line and both are trending downward, which is indicative of sustained selling pressure. Additionally, the histogram is increasing in negative territory, further emphasizing the bearish outlook. This could imply that BTCUSD may continue to face downward pressure in the near term unless a reversal pattern emerges.
• DISCLAIMER: Please note that the above analysis is not an investment suggestion by “Capitalcore Ltd”. This post has been published only for educational purposes.