- February 13, 2024
- Posted by: capadmin
- Category: Market News

Riding the Momentum: Comprehensive Ichimoku and MACD Technical Analysis for ETH/USD on H4
In the provided ETH/USD 4-hour chart, the Ichimoku Cloud is indicating a strong bullish trend. The price has broken above the Cloud, which is typically a buy signal within the Ichimoku system. The Cloud, or ‘Kumo’, acts as support and resistance levels, and a breakout above it suggests that the bulls have taken control. Additionally, the Conversion Line (Tenkan-sen) is above the Base Line (Kijun-sen), further reinforcing the bullish sentiment. The lagging span (Chikou Span) is above the price from 26 periods ago, which does not indicate any immediate resistance.
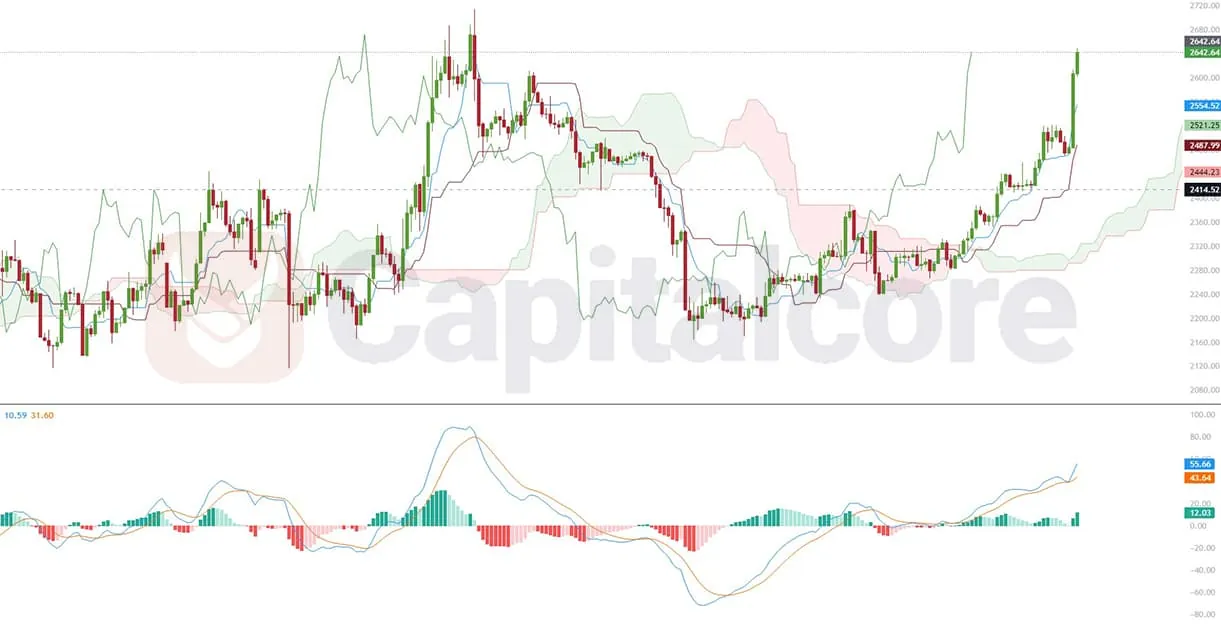
Chart Notes:
• Chart time-zone is UTC (+03:00)
• Candles’ time-frame is 4h.
The MACD indicator supports the bullish outlook, with the MACD line above the signal line and the histogram showing increasing bullish momentum. The separation between the MACD and the signal line is widening, which often suggests that the upward trend is gaining strength. However, traders should be cautious as the MACD is also a lagging indicator and may not predict short-term pullbacks or consolidations.
Considering the current position above the Ichimoku Cloud and the bullish MACD reading, the ETH/USD pair on the 4-hour timeframe appears to have a strong bullish bias. Traders might look for potential buy opportunities, especially on pullbacks to the Cloud, which can now act as a support level. It’s crucial to monitor the MACD for any signs of convergence that could indicate a loss of momentum or a potential trend reversal. As always, it’s essential to consider other market factors and news that could affect the cryptocurrency market and implement sound risk management strategies.
• DISCLAIMER: Please note that the above analysis is not an investment suggestion by “Capitalcore Ltd”. This post has been published only for educational purposes.