- February 22, 2024
- Posted by: capadmin
- Category: Market News
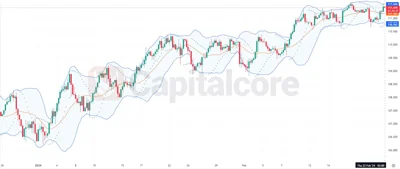
CADJPY Uptrend: Bollinger and SAR Insight
The H4 chart for CADJPY shows a recent uptrend as indicated by the Parabolic SAR, with the last four dots positioned below the candles, suggesting a bullish sentiment. The Bollinger Bands are moderately wide, indicating a period of higher market volatility. The price is currently near the upper band, signaling that CADJPY is potentially overbought. However, the continued support from the Parabolic SAR indicates that the upward momentum may still be intact.

Chart Notes:
• Chart time-zone is UTC (+03:00)
• Candles’ time-frame is 4h.
In the longer term, CADJPY’s price action is fluctuating within the upper half of the Bollinger Bands, indicating that the higher volatility is associated with an upward trend. The 20-period moving average is sloping upwards, reinforcing the bullish bias. Traders might look for potential buy signals as long as the Parabolic SAR remains below the price. If the price were to break below the middle Bollinger Band, it could signal a reversal or a consolidation phase. On the other hand, if the currency pair pushes above the upper Bollinger Band and remains there, it would further confirm the strength of the current trend. Caution is advised, as the proximity to the upper band also raises the possibility of a pullback or trend pause, especially if the Parabolic SAR dots flip above the price, signaling a potential change in trend direction.
• DISCLAIMER: Please note that the above analysis is not an investment suggestion by “Capitalcore Ltd”. This post has been published only for educational purposes.