- September 21, 2023
- Posted by: capadmin
- Category: Market News
Bullish Surge: CAD/JPY Analysis
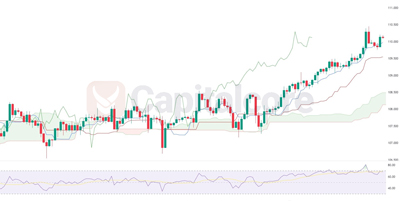
CAD/JPY is currently exhibiting a strong bullish trend on the 4-hour timeframe, with the RSI hovering around 80, indicating potential overbought conditions. Additionally, a green Ichimoku cloud under the current price candles suggests a support zone, although traders should exercise caution and monitor for signs of a possible correction.

Chart Notes:
• Chart time-zone is UTC (+03:00)
• Candles’ time-frame is 4h.
The CAD/JPY pair is currently displaying a bullish bias in the 4-hour timeframe, as indicated by the Relative Strength Index (RSI) hovering around 80. An RSI value of 80 suggests that the pair may be overbought, which could be a potential warning sign for traders to exercise caution.
Furthermore, the presence of a green Ichimoku cloud beneath the current price candles indicates a support zone. The Ichimoku cloud consists of two lines, the Senkou Span A (green) and Senkou Span B (red), and the area between them is known as the cloud. When the cloud is green, it often signifies a bullish sentiment in the market.
However, it’s essential to exercise caution, as an overbought condition could lead to a potential correction or a temporary pullback. Traders should closely monitor the RSI and look for signs of divergence or other technical indicators to confirm the strength of the bullish trend before making trading decisions. Additionally, keeping an eye on potential support levels within the Ichimoku cloud can provide valuable insights for risk management.
• DISCLAIMER: Please note that the above analysis is not an investment suggestion by “Capitalcore Ltd”. This post has been published only for educational purposes.