- August 21, 2023
- Posted by: Lewis Miller
- Category: Market News
Bearish Confirmation: Red Cloud
Analyzing the XRUSDT pair, we observe a bearish sentiment prevailing in the market. In Ichimoku terms, the price candles are positioned below the cloud formation, indicating a potential downtrend. This downward bias is further validated by the presence of a recent red cloud, traditionally signifying a bearish market outlook.
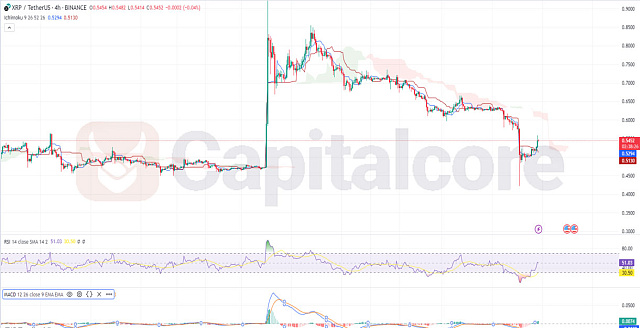
Chart Notes:
• Chart time-zone is UTC (+03:00)
• Candles’ time-frame is 4h.
In terms of the Relative Strength Index (RSI), the RSI value stands at 52%, above the 50% midpoint. While not significantly overbought, this value suggests a balanced momentum. Moreover, the RSI line is positioned above the RSI-based Moving Average (MA) line, underscoring the possibility of sustained upward pressure. Turning to Moving Average Convergence Divergence (MACD), both the MACD line and signal line are positioned below the histogram. This configuration implies a potential continuation of bearish momentum. Collectively, these indicators paint a picture of cautious market sentiment for XRUSDT, with bearish signals from Ichimoku, nuanced RSI behavior, and MACD alignment pointing towards further downward movement. As market conditions can change rapidly, ongoing monitoring and analysis are essential for informed trading decisions.
• DISCLAIMER: Please note that the above analysis is not an investment suggestion by “Capitalcore Ltd”. This post has been published only for educational purposes.