- October 6, 2023
- Posted by: capadmin
- Category: Market News
Navigating the CADCHF 4-Hour Technical Landscape
The CADCHF pair on the 4-hour chart presents an intriguing mix of technical signals. As the dynamics between the Canadian dollar and the Swiss franc evolve, key indicators are hinting at potential shifts in momentum.
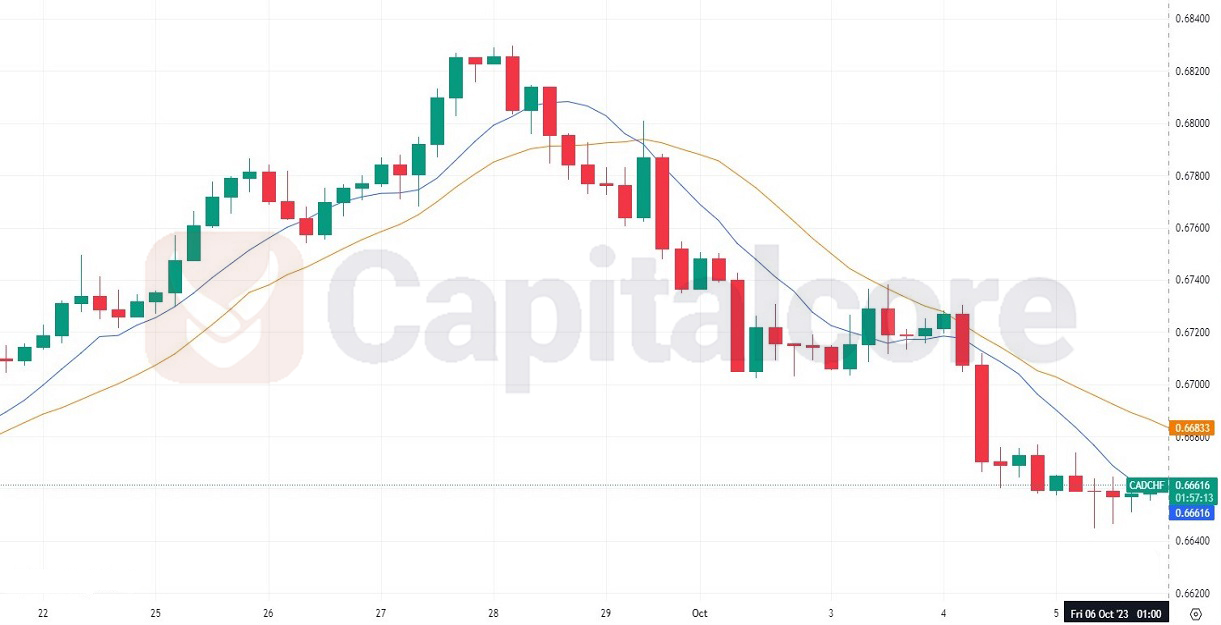
Chart Notes:
• Chart time-zone is UTC (+03:00)
• Candles’ time-frame is 4h.
On the 4-hour CADCHF chart, the short-term Simple Moving Average (SMA) line crossing below the long-term SMA is a bearish signal, indicating a potential downtrend or continuation of a downward move. This “death cross” often suggests that sellers are gaining control in the short term. Additionally, the Relative Strength Index (RSI) reading of 33.14 is approaching the oversold territory. While the current RSI level does not denote an immediate buy signal, it indicates that the pair might be undervalued and could experience a pullback or reversal soon. In summary, while the immediate outlook for CADCHF appears bearish due to the SMA crossover, the nearing oversold conditions on the RSI suggest traders should be vigilant for signs of a potential rebound or consolidation.
• DISCLAIMER: Please note that the above analysis is not an investment suggestion by “Capitalcore Ltd”. This post has been published only for educational purposes.