- August 4, 2023
- Posted by: Lewis Miller
- Category: Market News
Interpreting CAD/CHF Signals: Bullish Trend vs. Bearish Momentum
In the CAD/CHF currency pair analysis, several technical indicators offer insights into the current market conditions. Notably, the Ichimoku Cloud indicator shows the last cloud as green, confirming a bullish trend. The green cloud indicates that the price is above the cloud, and this is considered a positive signal for potential upward movement. Additionally, the candles are positioned above the cloud, further supporting the bullish outlook.
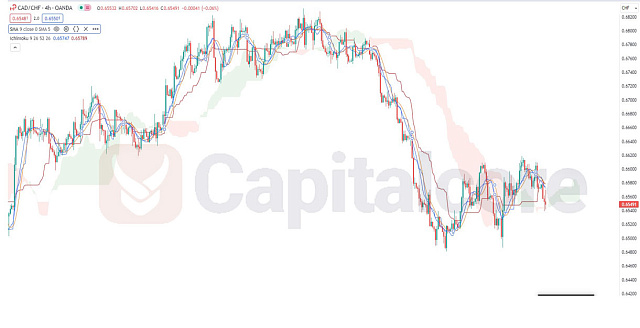
Chart Notes:
• Chart time-zone is UTC (+03:00)
• Candles’ time-frame is 4h.
However, traders should exercise caution as the Moving Average (MA) indicator suggests a possible sell trigger. The smoothing line is cutting the MA line downward, signaling a potential shift in momentum and a bearish trend. This bearish crossover could lead to a short-term downtrend. Given the mixed signals from the Ichimoku Cloud and Moving Average indicators, traders need to closely monitor price action and consider other factors, such as support and resistance levels, trading volume, and market sentiment, before making any trading decisions. It is essential to wait for further confirmation before entering any positions to ensure a more accurate assessment of the market direction.• DISCLAIMER: Please note that the above analysis is not an investment suggestion by “Capitalcore Ltd”. This post has been published only for educational purposes.