- December 14, 2023
- Posted by: capadmin
- Category: Market News
CAD/JPY Sellers Dominate: A Technical Perspective
The CAD/JPY pair has experienced notable fluctuations in recent trading sessions, showcasing a blend of bearish and bullish sentiments. The technical analysis on the 4-hour chart provides insights into potential price direction based on recent price action and technical indicators. Let’s delve into the details of the CAD/JPY chart to unpack the market’s current state and possible future movements.
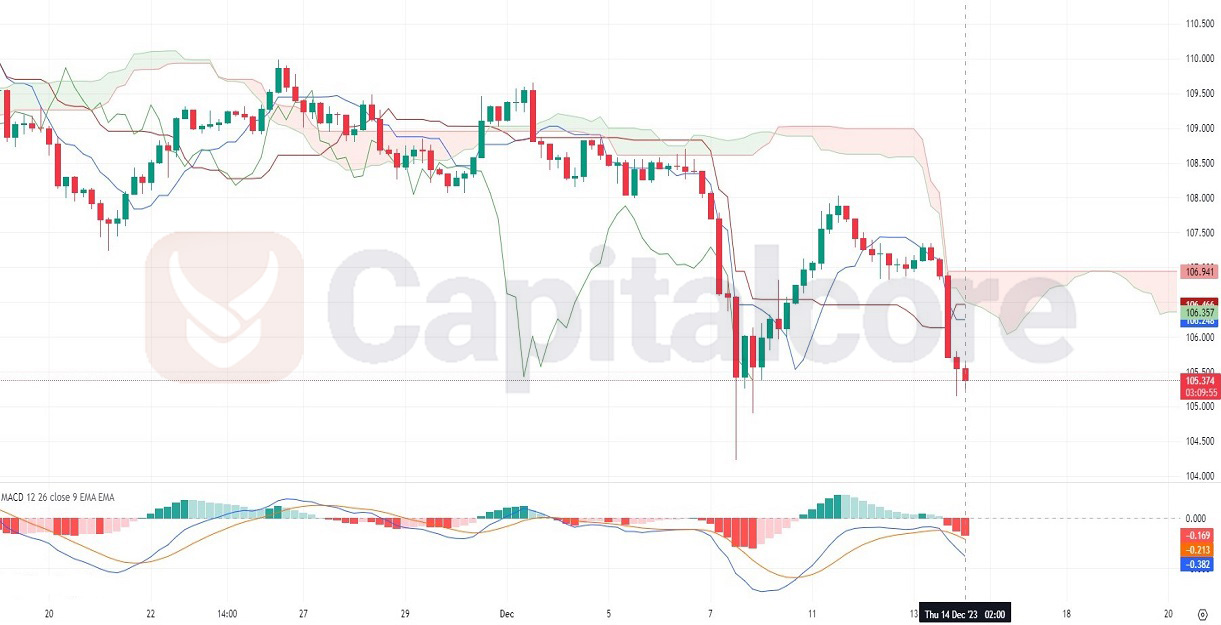
Chart Notes:
• Chart time-zone is UTC (+03:00)
• Candles’ time-frame is 4h.
Upon examining the 4-hour chart for CAD/JPY, we observe a downtrend with the price breaking below the Ichimoku cloud, indicating a bearish market environment. The recent candles have closed beneath the cloud, with the latest one forming a long red body, suggesting strong selling pressure. The Moving Average Convergence Divergence (MACD) histogram is below the baseline and has transitioned from a period of bullish convergence to bearish divergence, as the red bars increase in length, reinforcing the bearish outlook. The trading strategy in this bearish context would typically involve looking for potential short positions on pullbacks to resistance levels or breakout points beneath the current consolidation.
• DISCLAIMER: Please note that the above analysis is not an investment suggestion by “Capitalcore Ltd”. This post has been published only for educational purposes.