- August 15, 2023
- Posted by: Lewis Miller
- Category: Market News
Navigating CHFJPY: RSI and Bollinger Bands
The CHFJPY currency pair has captivated traders with its recent behavior, prompting close analysis. As the Relative Strength Index (RSI) hovers around the 70 level amidst a bullish trend, and the Bollinger Bands exhibit a balance between width, this pairing offers intriguing potential for both caution and opportunity in the forex market.
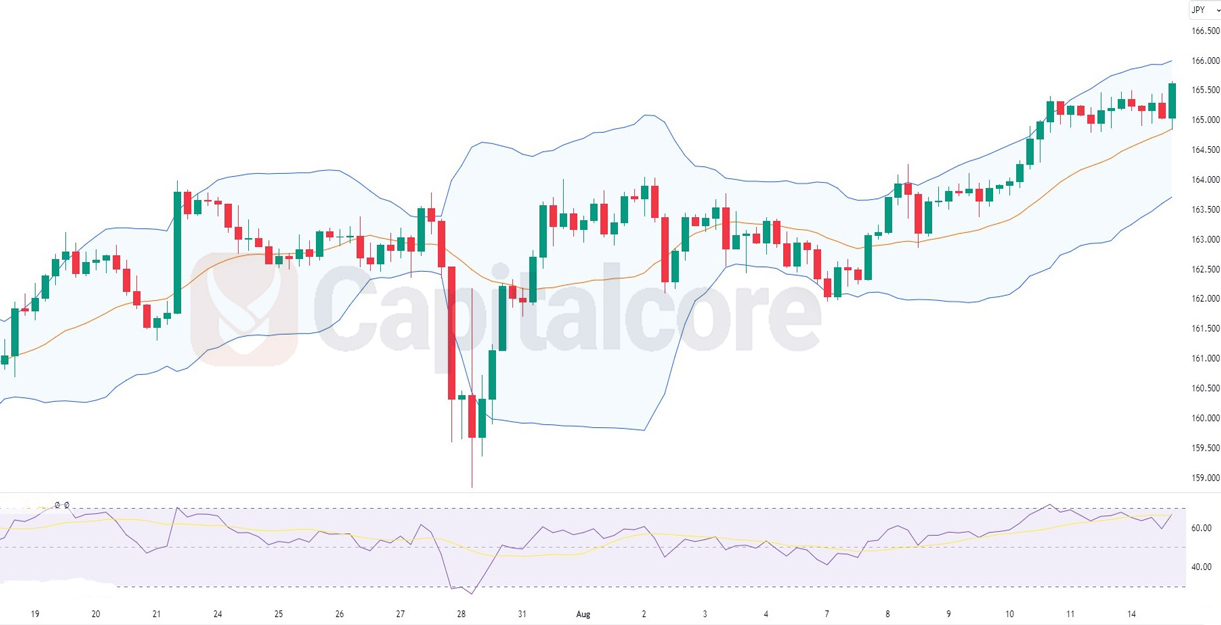
Chart Notes:
• Chart time-zone is UTC (+03:00)
• Candles’ time-frame is 4h.
The CHFJPY presents an intriguing picture with its recent price action. The Relative Strength Index (RSI) has maintained a consistent position near the 70 level, suggesting a degree of overbought conditions. This aligns with the prevailing bullish trend, indicating potential caution for traders considering new long positions due to the potential for a correction or retracement.
Furthermore, the Bollinger Bands appear to be in a middle ground, neither significantly wide nor tightly constricted. This suggests that volatility might be moderate, allowing room for price movement without extreme fluctuations. Traders could watch for potential breakout signals when the Bollinger Bands begin to expand or observe how the price interacts with the upper and lower bands to anticipate potential shifts in trend direction or momentum.
• DISCLAIMER: Please note that the above analysis is not an investment suggestion by “Capitalcore Ltd”. This post has been published only for educational purposes.