- July 20, 2023
- Posted by: Lewis Miller
- Category: Market News
Mixed Signals: Recent RSI Surge and MA Crossover
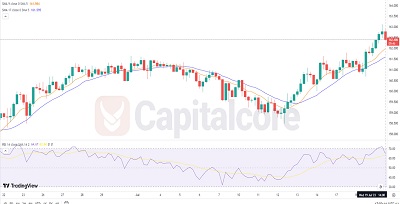
In the analysis of CHFJPY, the recent sharp increase in the Relative Strength Index (RSI) followed by a gradual decline, alongside the shorter-term Moving Average (MA) crossing above the longer-term MA, presents a mixed picture for the currency pair. Traders will need to closely monitor these technical indicators, along with other factors, to assess the potential continuation of bullish momentum or the possibility of a reversal in CHFJPY.
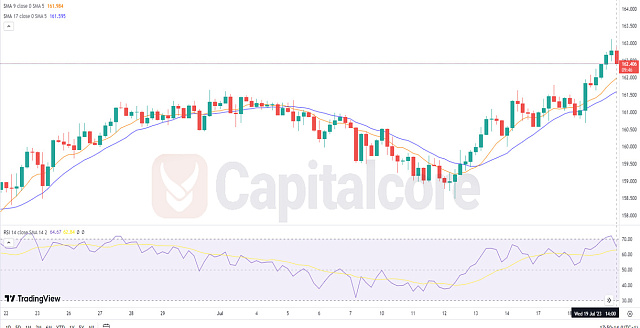
Chart Notes:
• Chart time-zone is UTC (+03:00)
• Candles’ time-frame is 4h.
The CHFJPY analysis suggests a mixed outlook for the currency pair. The Relative Strength Index (RSI) has experienced a sharp increase recently, indicating a surge in buying pressure and potential bullish momentum. However, the current slow decline in the RSI, with a reading of 63, suggests a possible weakening of the upward momentum. Additionally, the shorter-term Moving Average (MA) crossing above the longer-term MA implies a potentially bullish signal. Traders should carefully monitor the price action, considering additional technical indicators and fundamental factors, to assess the likelihood of a continued upward trend or a potential reversal.
• DISCLAIMER: Please note that the above analysis is not an investment suggestion by “Capitalcore Ltd”. This post has been published only for educational purposes.