- February 14, 2024
- Posted by: capadmin
- Category: Market News
Interpreting CAD/JPY’s Dynamics
In the foreign exchange market, examining the CAD/JPY pair on the H4 time frame with a blend of technical indicators offers a nuanced view of market trends and potential shifts. Bollinger Bands, Stochastic RSI, and MACD serve as the pillars of this technical analysis, providing insights into volatility, momentum, and market sentiment.
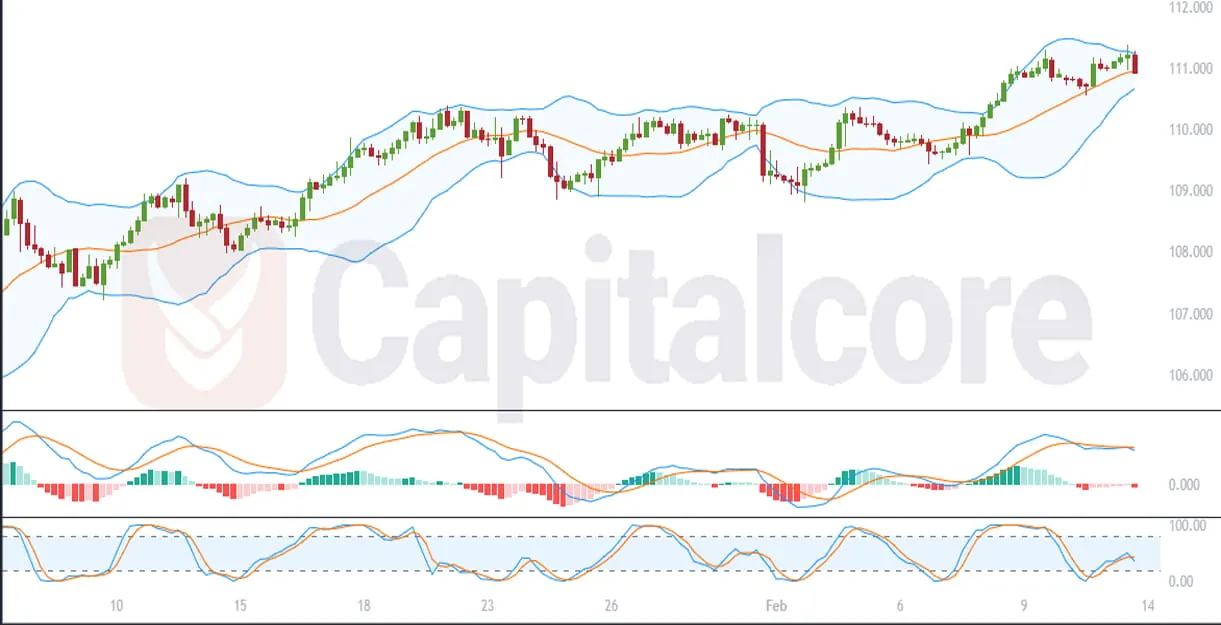
Chart Notes:
• Chart time-zone is UTC (+03:00)
• Candles’ time-frame is 4h.
Bollinger Bands encase the price action, revealing periods of high volatility when bands are far apart and lower volatility when they contract. Currently, the price is hovering near the lower Bollinger Band, suggesting that the market may be in a bearish phase with potential oversold conditions.
The Stochastic RSI, a momentum oscillator that compares a particular closing price of an asset to a range of its prices over a certain period of time, is plotted in a separate window below the price chart. Its value oscillates between 0 and 100, and readings above 80 indicate overbought conditions, while readings below 20 suggest oversold conditions. The exact position of the Stochastic RSI within these ranges provides additional context for the strength of the current trend and potential reversal points.
The MACD indicator, positioned below the Stochastic RSI, consists of two lines: the MACD line and the signal line. A bearish momentum is suggested when the MACD line crosses below the signal line, while a bullish crossover occurs when the MACD line moves above the signal line.
In summary, the CAD/JPY pair on the H4 chart, with the current configuration of Bollinger Bands, Stochastic RSI, and MACD, seems to point towards a bearish market sentiment. However, traders should monitor the Stochastic RSI for potential oversold signals and the MACD for signs of a momentum shift, which could presage a change in trend direction. These indicators combined can help in identifying strategic entry and exit points in the market, but they should be used in conjunction with other forms of analysis and up-to-date market news.
• DISCLAIMER: Please note that the above analysis is not an investment suggestion by “Capitalcore Ltd”. This post has been published only for educational purposes.