- February 21, 2024
- Posted by: capadmin
- Category: Market News

Interpreting Gold’s Movement
Analyzing the Gold market on the H4 time frame, as shown in the uploaded chart, we see that a combination of technical indicators is utilized to assess the precious metal’s momentum and probable future trajectory. The Bollinger Bands, MACD, and RSI are central in this analysis, each offering distinct perspectives on market behavior.
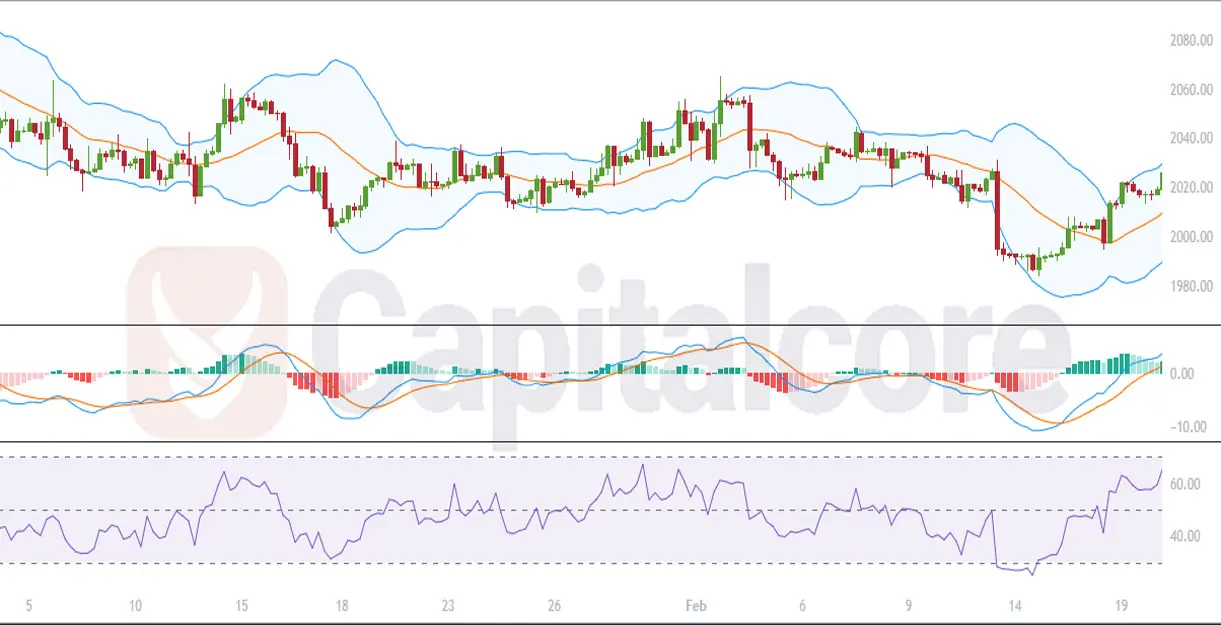
Chart Notes:
• Chart time-zone is UTC (+03:00)
• Candles’ time-frame is 4h.
The Bollinger Bands indicate that the price is recovering from the lower band, suggesting a bullish retracement or a potential reversal from the recent bearish trend. The bandwidth, which is moderately wide, implies that there has been significant volatility in the market.
The MACD indicator, positioned below the price chart, shows that the MACD line (blue) has crossed above the signal line (orange), typically a bullish indicator. The histogram also reflects growing bullish momentum as the bars increase in height above the baseline.
Lastly, the RSI is trending upwards towards the mid-line 50 level, moving away from the oversold territory. This ascent toward the neutral 50 level indicates decreasing bearish momentum and a potential buildup of bullish pressure.
In conclusion, the H4 chart for Gold is exhibiting signs of a shift from a bearish to a bullish trend, as indicated by the Bollinger Bands’ recovery, the MACD line crossing above the signal line, and the RSI’s upward movement. Traders should monitor these indicators closely for further signs of bullish momentum, such as the price reaching the middle or upper Bollinger Band, or the RSI surpassing the 50 level, which could confirm the change in trend direction.
• DISCLAIMER: Please note that the above analysis is not an investment suggestion by “Capitalcore Ltd”. This post has been published only for educational purposes.