- February 7, 2024
- Posted by: capadmin
- Category: Market News
Interpreting USD/CAD’s Movement
Analyzing the USD/CAD market on the H4 time frame, as presented in the chart, we engage a suite of technical indicators to dissect the currency pair’s current state and forecast its possible direction. The Bollinger Bands, RSI (Relative Strength Index), and Stochastic RSI serve as the cornerstone of this technical scrutiny, each offering unique insights into the pair’s volatility and momentum.
The Bollinger Bands show the price oscillating near the upper band, commonly associated with an overbought condition in the market or a strong uptrend. The current proximity to the upper band might indicate a potential resistance area or a precursor to a pullback if the price reverts to mean levels.
Observing the RSI, we note that it hovers around the 60 mark, signifying strong buying pressure; however, it’s not yet in the traditional overbought territory (above 70). This suggests that there is still room for upward movement before the market is considered overbought.
The Stochastic RSI, a momentum oscillator that compares a security’s closing price to its price range over a specific period, is situated in the upper region, near the 80 level, indicating that the market could be approaching overbought conditions. This reading, alongside the RSI, could signal an imminent slowdown or reversal if the indicators cross below their respective threshold levels.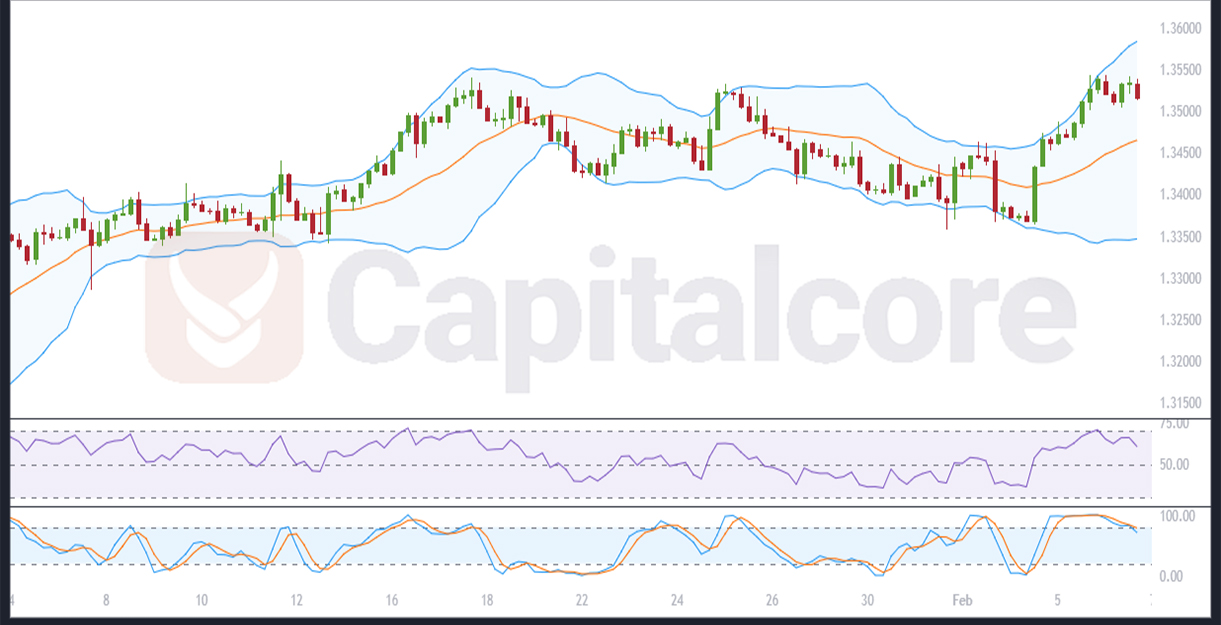
Chart Notes:
• Chart time-zone is UTC (+03:00)
• Candles’ time-frame is 4h.
In summary, the USD/CAD pair on the H4 chart is demonstrating signs of an uptrend, as shown by the price’s position relative to the Bollinger Bands. The RSI and Stochastic RSI both indicate strong momentum, although nearing levels that often suggest overbought conditions. Traders should monitor these indicators closely for any signs of divergence or retracement, such as the price moving back within the Bollinger Bands or the RSI indicators falling below their current levels, which could hint at a shift in market sentiment.
• DISCLAIMER: Please note that the above analysis is not an investment suggestion by “Capitalcore Ltd”. This post has been published only for educational purposes.