- September 11, 2023
- Posted by: capadmin
- Category: Market News
Ethereum’s Pivotal Moments: 4h Analysis Breakdown
As Ethereum weaves its narrative in the vast tapestry of the crypto realm, the ETHUSD pairing emerges as a barometer of its ambition and potential. Diving into its latest trajectories, we unearth the patterns and possibilities of this digital titan. Step with us into the world of Ether’s market dance.
![]()
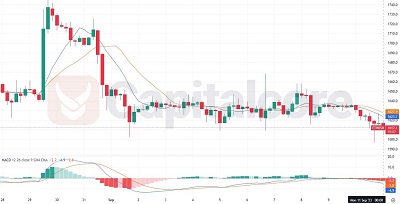
Chart Notes:
• Chart time-zone is UTC (+03:00)
• Candles’ time-frame is 4h.
Ethereum’s recent 4-hour chart movements suggest a cautious bearish undertone for the ETHUSD pair. The short-term Simple Moving Average (SMA) has narrowly crossed below the long-term SMA, hinting at a potential shift in momentum, though the proximity suggests a possible hesitancy in the market. A more pronounced bearish sign is the MACD line’s descent below the Signal line, with current readings at -4.9 and -2.8, respectively. This divergence is further echoed by the histogram’s negative value at -2.1, indicating increased selling pressure. While these signs hint at a possible downward movement, the closeness of the SMA cross suggests traders should remain vigilant for any sudden reversals or consolidations. As always, it’s vital to factor in broader market sentiment and any fundamental developments.
• DISCLAIMER: Please note that the above analysis is not an investment suggestion by “Capitalcore Ltd”. This post has been published only for educational purposes.