- August 2, 2023
- Posted by: Lewis Miller
- Category: Market News
ETHUSD Technical Review: Sideways Price Action
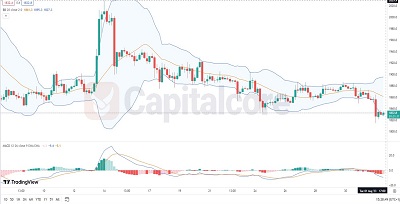
In this review, we’ll explore the recent developments in the Ethereum-to-US Dollar trading pair. The widening Bollinger bands, coupled with a sideways price movement, hint at potential upcoming volatility and breakout opportunities. Additionally, the MACD histogram’s positioning near the zero line indicates a balanced market sentiment. Join us as we delve into the charts to uncover potential trading strategies and insights for ETHUSD.

Chart Notes:
• Chart time-zone is UTC (+03:00)
• Candles’ time-frame is 4h.
The ETHUSD analysis reveals intriguing market dynamics. The Bollinger bands, which had tightened, have now widened, suggesting an impending surge in volatility. This development may signal potential breakout opportunities in the near future. Currently, the general price movement appears to be sideways, indicating a lack of a clear trend. This could present challenges for trend-following strategies but might offer opportunities for range-bound trading tactics. The MACD histogram’s prolonged hover around the zero line highlights a balanced state between bullish and bearish forces. Traders should exercise caution and remain alert for decisive price movements outside the Bollinger bands to capitalize on potential trading setups.
• DISCLAIMER: Please note that the above analysis is not an investment suggestion by “Capitalcore Ltd”. This post has been published only for educational purposes.