- November 3, 2023
- Posted by: capadmin
- Category: Market News
Technical Breakdown: EURCAD’s Market Momentum
The EURCAD pair has been showcasing intriguing movements on the H4 chart, capturing the attention of forex enthusiasts. Through the lens of technical indicators like Bollinger Bands, MACD, and Fibonacci retracement lines, one can decipher the potential future direction of this pair. The ensuing analysis delves deeper into these indicators to provide a clearer picture of the pair’s trajectory. Let’s dive into the specifics of the EURCAD dynamics.
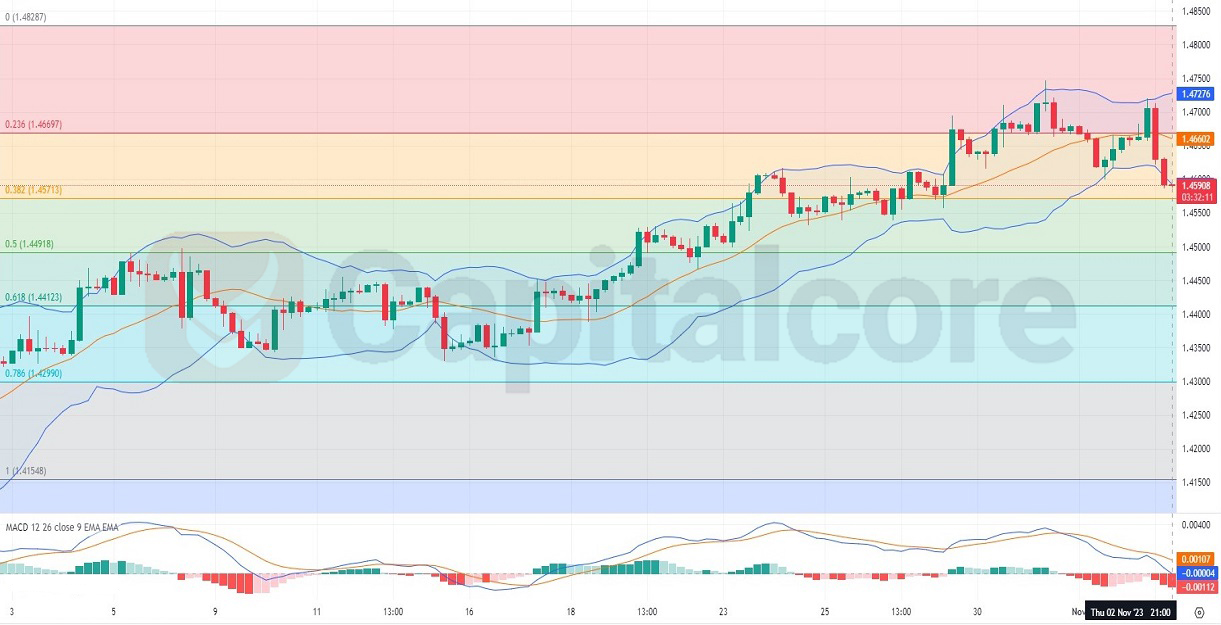
Chart Notes:
• Chart time-zone is UTC (+03:00)
• Candles’ time-frame is 4h.
The EURCAD pair on the H4 chart is demonstrating a consolidating pattern. The Bollinger Bands show that the price has frequently touched the upper band, indicating bullish pressure, but has recently returned towards the middle band, hinting at a potential cooling of bullish momentum. The MACD appears to be converging towards its signal line, suggesting a potential change in trend or a consolidation phase. The Fib retracement lines indicate that the pair found resistance around the 0.236 level, currently retracing to deeper levels. The 0.618 level, a key Fibonacci retracement, might serve as significant support in the near term.
Traders should watch for potential breakout or breakdown signals from these key levels to determine the next possible move.
• DISCLAIMER: Please note that the above analysis is not an investment suggestion by “Capitalcore Ltd”. This post has been published only for educational purposes.