- November 16, 2023
- Posted by: capadmin
- Category: Market News
NZDUSD Uptrend Intact
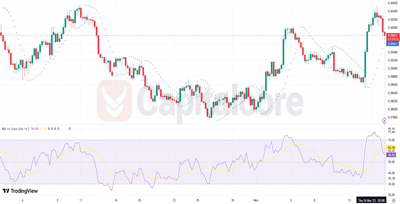
The NZDUSD 4-hour chart presents a compelling case for a bullish reversal, characterized by a pattern of higher lows and higher highs—a classic sign of an uptrend. The Parabolic SAR has formed a dotted line beneath the price candles, suggesting a strong uptrend. Additionally, the recent candles are predominantly green with substantial bodies, indicating strong buying pressure. This uptrend is further supported by the RSI, which remains above the median line of 50, signaling continued bullish momentum.
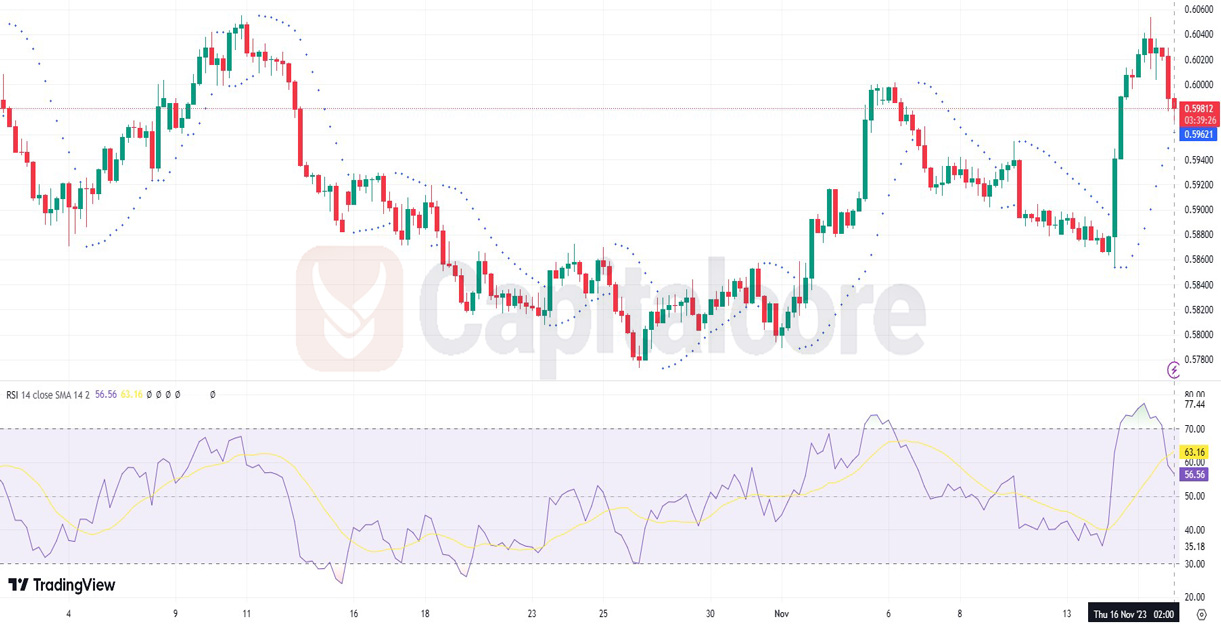
Chart Notes:
• Chart time-zone is UTC (+03:00)
• Candles’ time-frame is 4h.
Looking closer at the indicators, the Relative Strength Index is currently above the 50 mark, hovering around the mid-60s, which points to a strong bullish momentum without immediate overbought concerns. Traders typically consider an RSI above 70 as overbought, but the current positioning provides some space before the market reaches those levels. The chart also shows the RSI line having a slight upward trajectory, indicating that buyers are gradually gaining strength. The price action above the dotted line of the Parabolic SAR suggests that as long as the price remains above these dots, the bullish trend is likely to persist. It is important for traders to monitor these levels closely, as a break below could signify a potential shift in the market sentiment.
• DISCLAIMER: Please note that the above analysis is not an investment suggestion by “Capitalcore Ltd”. This post has been published only for educational purposes.