- June 6, 2024
- Posted by: james w
- Category: Market News
EUR/USD H4 Price Action and Indicators
The EUR/USD forex pair, representing the Euro and the US Dollar, is one of the most traded currency pairs globally. Currencies are influenced by a myriad of economic factors and news events, making their analysis crucial for traders. The EUR USD pair’s chart performance today will be particularly impacted by several key economic indicators and events.
Fundamental analysis for the EURUSD today focuses on a range of economic indicators and events. The upcoming release of the German Factory Orders, with a forecast of 0.6%, could positively influence the Euro if the actual figures surpass expectations, signaling increased manufacturing activity. Similarly, the Italian Retail Sales forecast of 0.3% and the broader Eurozone Retail Sales expected at -0.2% will be watched closely as they gauge consumer spending. The European Parliamentary Elections and the ECB’s monetary policy updates, including the Main Refinancing Rate and the ECB Press Conference, are high-impact events likely to cause significant volatility. Additionally, US data such as the Unemployment Claims forecasted at 220K will be crucial for the USD’s performance, potentially affecting the EUR/USD pair’s movement throughout the day.
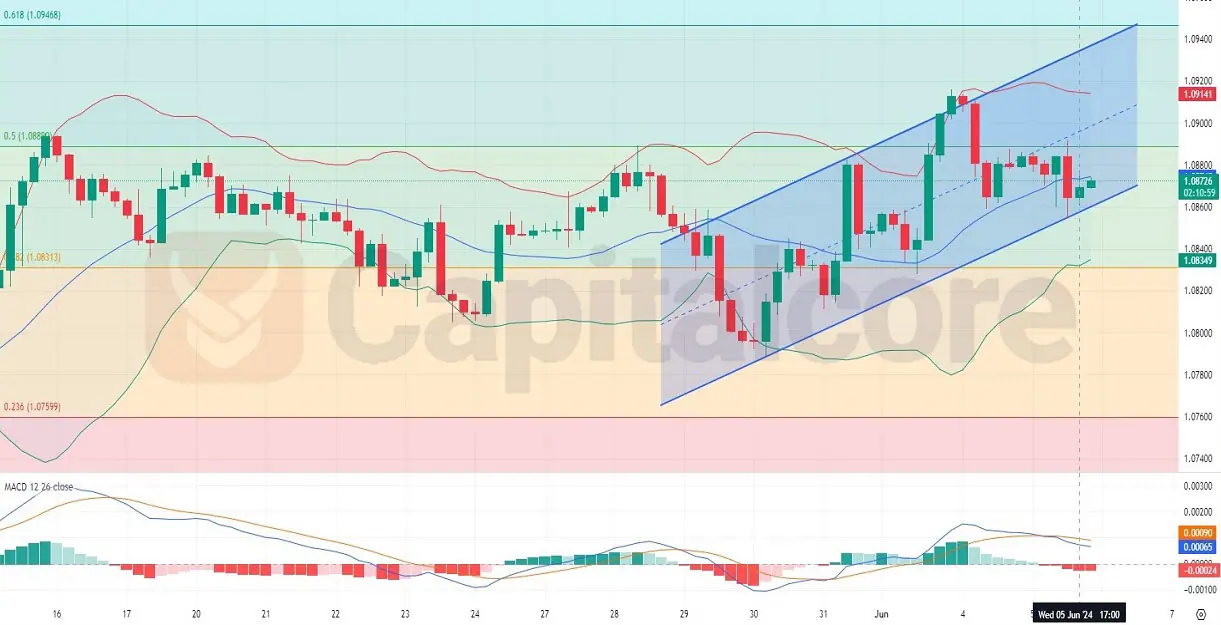
Chart Notes:
• Chart time-zone is UTC (+03:00)
• Candles’ time-frame is 4h.
Analyzing the EUR-USD H4 chart, the price has been trending within an ascending channel, indicating a short-term bullish trend. The last 10 candles of EURUSD’s H4 chart exhibit a mixture of bullish and bearish sentiments, with five green candles and the recent bullish candles suggesting a potential upward continuation. The Bollinger Bands have slightly contracted, yet they remain relatively wide, reflecting ongoing volatility. The price oscillates around the middle band, indicating consolidation within the broader uptrend. The MACD indicator, however, shows a bearish signal with the MACD line crossing below the signal line and a red histogram, implying potential downward pressure. Despite the MACD’s bearish outlook, the price’s proximity to the middle band and the overall ascending channel suggests the bullish momentum could still persist, albeit with caution.