- April 24, 2024
- Posted by: capadmin
- Category: Market News
Shifting Winds for EUR/USD
The EUR/USD pair on the 4-hour chart is showing signs of a potential uptrend after a period of consolidation. The price has recently crossed above the Ichimoku cloud, which may indicate a shift in momentum from bearish to bullish. The cloud acts as support in this context, with the baseline (the red line) potentially serving as a dynamic support level. The price is also trading above the Kijun-sen and Tenkan-sen lines, suggesting a short-term bullish bias. The future cloud is green and appears to be widening, further reinforcing the possibility of an uptrend.
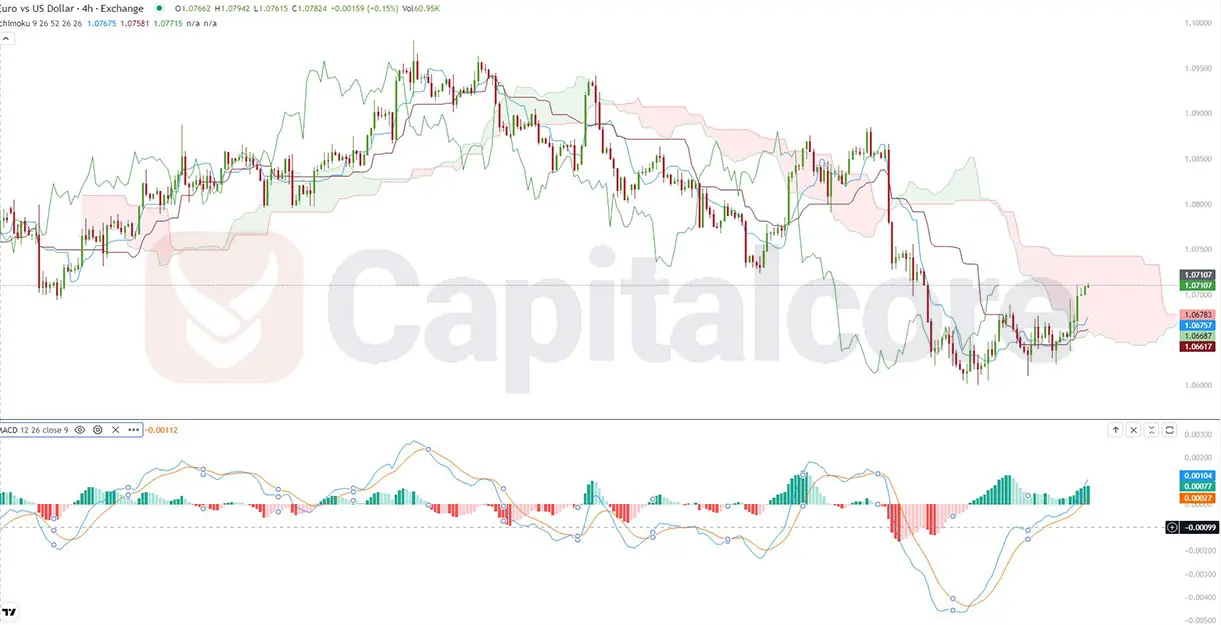
Chart Notes:
• Chart time-zone is UTC (+03:00)
• Candles’ time-frame is 4h.
The MACD indicator presents a bullish signal, with the MACD line crossing above the signal line and the histogram displaying increasing bullish momentum as the bars grow in height. This could indicate that buyers are gaining control. However, traders should proceed with caution, as the potential for volatility is indicated by the spacing between the Bollinger Bands. If the price continues to hold above the cloud and the MACD maintains its bullish posture, we might expect further upward movement in the EUR/USD pair.
• DISCLAIMER: Please note that the above analysis is not an investment suggestion by “Capitalcore Ltd”. This post has been published only for educational purposes.