- July 7, 2023
- Posted by: Lewis Miller
- Category: Market News
EUR/USD Downtrend
The EUR/USD pair is exhibiting a descending triangle pattern, with a series of lower highs and a horizontal support line. This pattern suggests a potential continuation of the downtrend. Additionally, the Relative Strength Index (RSI) being below 50 indicates bearish momentum and adds to the overall negative sentiment for the pair. Traders may monitor for a breakdown below the support level as a potential signal for further downside movement.
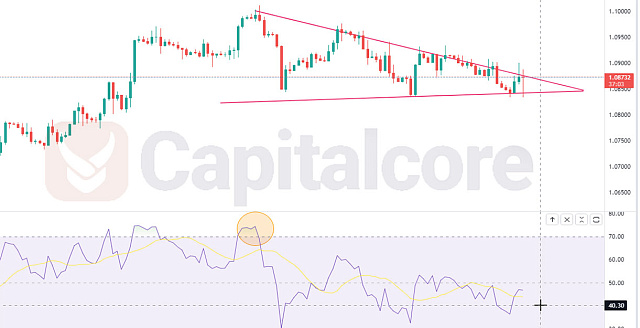
Chart Notes:
• Chart time-zone is UTC (+03:00)
• Candles’ time-frame is 4h.
The EUR/USD pair is currently displaying a descending triangle pattern, characterized by a series of lower highs and a horizontal support line. This formation suggests a potential continuation of the existing downtrend. Furthermore, the Relative Strength Index (RSI) is below 50, indicating bearish momentum in the market. However, it’s worth noting that the RSI line has recently cut above the base line, suggesting a possible shift towards upward momentum. Traders should closely monitor the price action and wait for confirmation of a breakout or further price development before making trading decisions.
• DISCLAIMER: Please note that the above analysis is not an investment suggestion by “Capitalcore Ltd”. This post has been published only for educational purposes.