- February 27, 2024
- Posted by: capadmin
- Category: Market News
Momentum Shifts in Forex: A Technical Dive into EUR/USD’s Latest Trends
The MACD line (blue) is above the signal line (orange), indicating bullish momentum as the faster moving average is above the slower one. This suggests that the short-term momentum is currently stronger than the long-term momentum, often interpreted as a buying signal. However, the histogram, which represents the difference between the MACD line and the signal line, shows a mix of positive and negative bars without a clear trend. The small histogram bars suggest that although there is bullish momentum, it might not be very strong as the difference between the MACD and signal lines is not substantial.
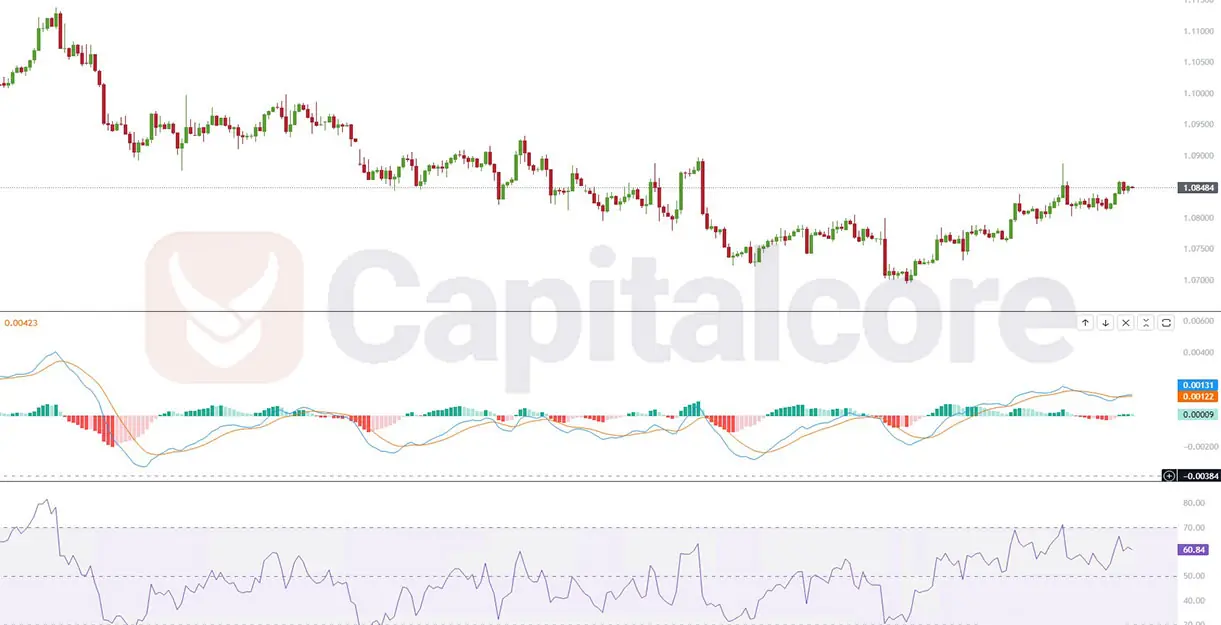
Chart Notes:
• Chart time-zone is UTC (+03:00)
• Candles’ time-frame is 4h.
The RSI is hovering around 60, which is above the midline (50) but below the overbought threshold of 70. An RSI level of 60 indicates some bullish momentum, as it is on the higher side of the neutral range but has not yet reached levels where the market is considered overbought. This may be interpreted as the market having more room to continue its uptrend before potentially becoming overbought. However, as the RSI is not far from the overbought threshold, traders might be cautious and watch for potential signs of a reversal if the RSI approaches or exceeds 70.
• DISCLAIMER: Please note that the above analysis is not an investment suggestion by “Capitalcore Ltd”. This post has been published only for educational purposes.