- April 30, 2024
- Posted by: capadmin
- Category: Market News
EUR/USD Bearish Trend Deepens on H4 Chart
The EUR/USD pair, one of the most traded currency pairs globally, offers insights into the relative economic strengths of the Eurozone and the United States. This technical analysis examines the latest trends and patterns observed in the H4 timeframe, utilizing Bollinger Bands and MACD indicators to assess potential movements. As we delve into the current price actions, we note a recent downturn with consecutive negative candles, suggesting a bearish sentiment in the near term.
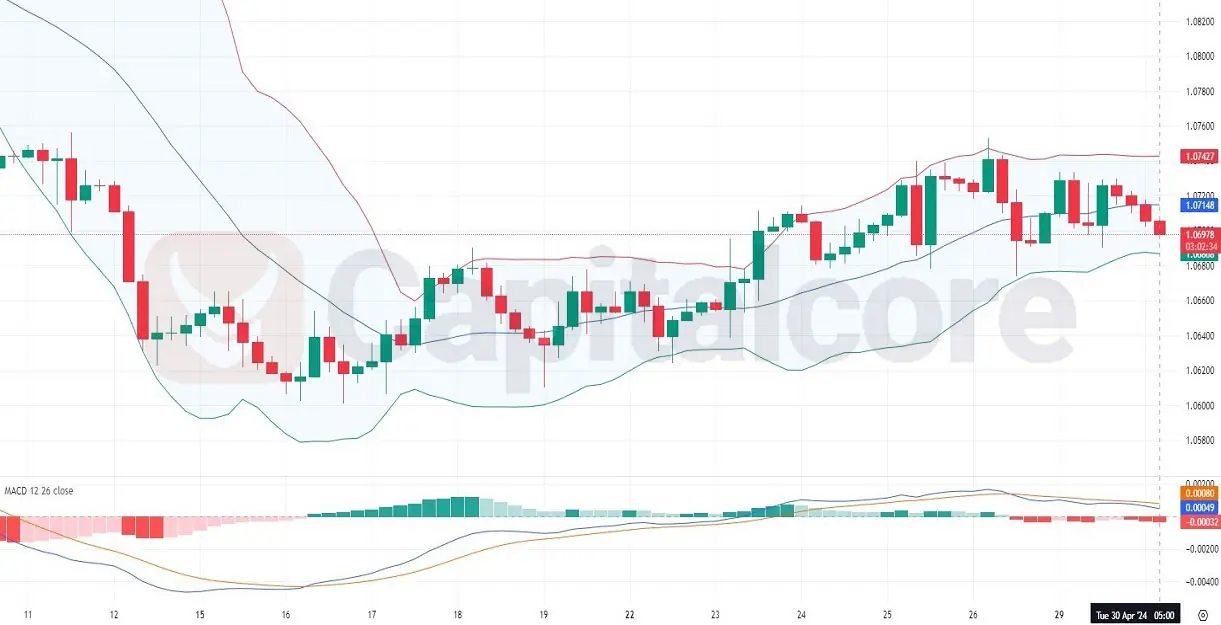
Chart Notes:
• Chart time-zone is UTC (+03:00)
• Candles’ time-frame is 4h.
In the H4 chart for EUR/USD, the price has been experiencing a downtrend, as indicated by the last three candles and the ongoing negative candle. The Bollinger Bands show the price moving toward the lower band, hinting at increased volatility and a potential continuation of the bearish trend. The MACD indicator supports this view, with the MACD line below the signal line and both trending downwards, reflecting growing bearish momentum. The consistent decline in price below the midline of the Bollinger Bands suggests that sellers are currently controlling the market dynamics.
• DISCLAIMER: Please note that the above analysis is not an investment suggestion by “Capitalcore Ltd”. This post has been published only for educational purposes.