- February 20, 2024
- Posted by: capadmin
- Category: Market News
Navigating the EUR/USD Pair: Insights from Ichimoku Cloud and MACD Indicators
The EUR/USD currency pair depicted in the chart is showing clear signals via the Ichimoku and MACD indicators. The Ichimoku Cloud (or Ichimoku Kinko Hyo) presents a mixed outlook; the price is currently moving above the cloud, indicating a potential bullish sentiment. However, the cloud itself appears to be thinning, which could suggest a weakening of the current trend or potential trend reversal. The proximity of the price to the cloud also indicates a level of support or resistance, cautioning traders to be vigilant for signs of a breakout.
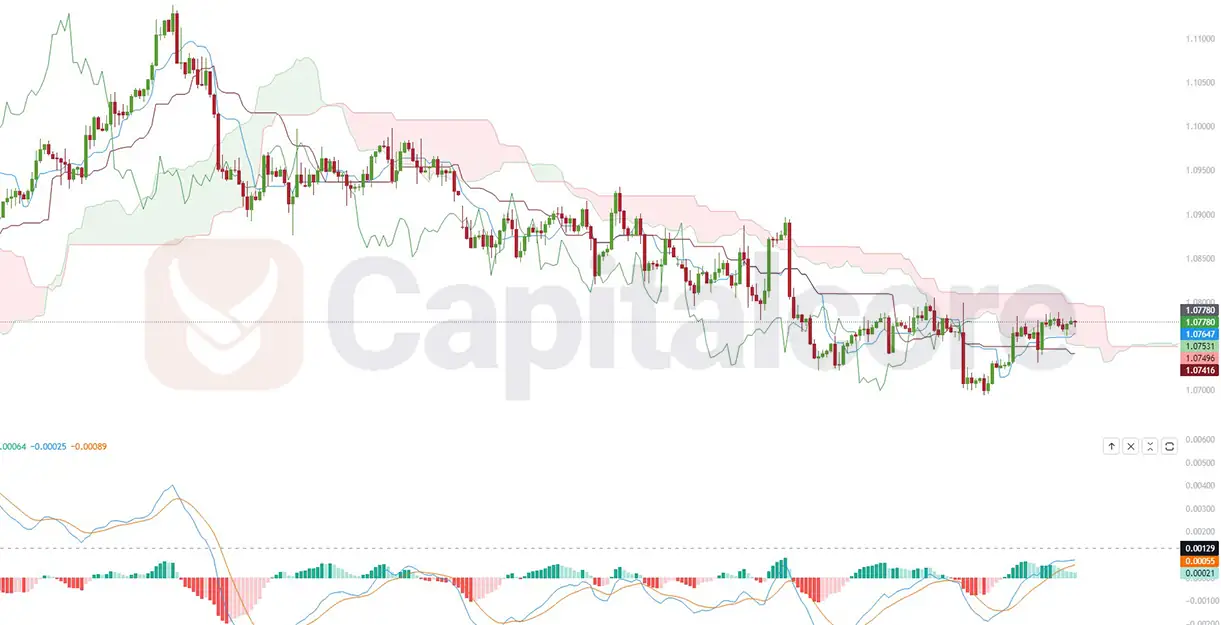
Chart Notes:
• Chart time-zone is UTC (+03:00)
• Candles’ time-frame is 4h.
Additionally, the MACD indicator reinforces this cautious outlook. The MACD line is hovering just above the signal line, suggesting a mild bullish momentum. Nevertheless, the histogram bars are quite short, implying that the bullish momentum is not particularly strong. The lack of divergence between the MACD line and the signal line suggests that while the immediate trend leans towards bullish, there isn’t substantial momentum behind the movement, and traders should be wary of potential shifts in market sentiment or volatility.
• DISCLAIMER: Please note that the above analysis is not an investment suggestion by “Capitalcore Ltd”. This post has been published only for educational purposes.