- September 1, 2023
- Posted by: capadmin
- Category: Market News
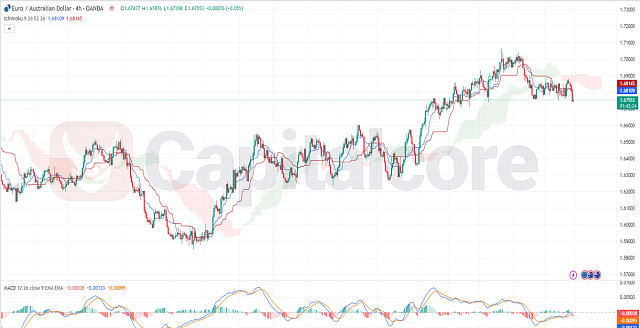
EURAUD: Cloud and Candles Interaction
In the context of the EURAUD currency pair, the recent technical analysis reveals a potentially bearish outlook. The Ichimoku Cloud indicator, a comprehensive tool integrating multiple aspects of price action, presents a noteworthy observation. The most recent cloud formed on the chart is notably red, suggesting a prevailing downward pressure. Additionally, the price candles have consistently remained positioned below this red cloud, indicating a prevailing bearish sentiment in the market. It is worth highlighting that both the Conversion Line and the Base Line of the Ichimoku Cloud are closely hovering exactly on top of the price candles, further accentuating the resistance to any potential bullish movement.
Chart Notes:
• Chart time-zone is UTC (+03:00)
• Candles’ time-frame is 4h.
Furthermore, the Moving Average Convergence Divergence (MACD) oscillator corroborates the bearish sentiment. Both the MACD line and the signal line are found beneath the histogram, signifying the strength of downward momentum. This alignment suggests that the selling pressure has gained traction, potentially leading to further declines in the EURAUD pair. Traders and investors should be cautious in light of these technical indications, as they collectively suggest a higher probability of continued bearish movement in the near term for the EURAUD currency pair.
• DISCLAIMER: Please note that the above analysis is not an investment suggestion by “Capitalcore Ltd”. This post has been published only for educational purposes.