- July 19, 2023
- Posted by: Lewis Miller
- Category: Market News

Technical Breakdown of AUDCAD: RSI Pullback and MACD Signal Shift
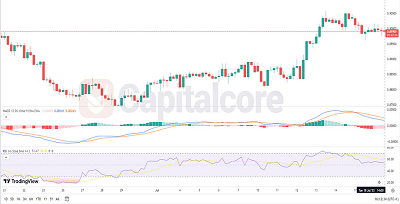
AUDCAD is currently experiencing notable technical movements. The Relative Strength Index (RSI) has smoothly declined from 70 to 50, indicating a decrease in bullish momentum. Additionally, the Moving Average Convergence Divergence (MACD) line has crossed below the signal line, potentially signaling a shift toward bearish sentiment. Traders should closely monitor these developments for potential trading opportunities in the AUDCAD pair.

Chart Notes:
• Chart time-zone is UTC (+03:00)
• Candles’ time-frame is 4h.
AUDCAD is displaying notable technical developments. The Relative Strength Index (RSI) has exhibited a smooth decline from the overbought level of 70 to 50, indicating a decrease in bullish momentum and potential consolidation. Furthermore, the Moving Average Convergence Divergence (MACD) line has crossed below the signal line, suggesting a bearish signal. This indicates a shift towards potential downside pressure. Traders should pay close attention to further price action and monitor for potential bearish signals or a continuation of the downward trend in AUDCAD. Risk management and additional analysis are essential for informed trading decisions.
• DISCLAIMER: Please note that the above analysis is not an investment suggestion by “Capitalcore Ltd”. This post has been published only for educational purposes.