- July 18, 2023
- Posted by: Lewis Miller
- Category: Market News
Stochastic Line and Price Divergence in EURCHF: A Closer Look
In the 4-hour timeframe analysis of EURCHF, the stochastic line has maintained an elevated level around 80, occasionally surpassing it, for approximately 32 hours, while the price has exhibited a smooth downward trend. These observations indicate a potential divergence between the overbought stochastic indicator and the bearish price movement in the EURCHF pair.
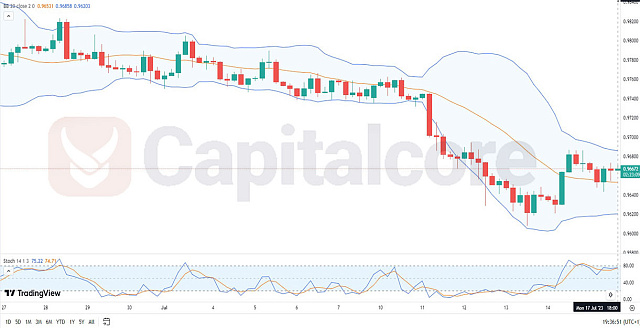
Chart Notes:
• Chart time-zone is UTC (+03:00)
• Candles’ time-frame is 4h.
In the 4-hour timeframe analysis of EURCHF, the stochastic line has been consistently hovering around 80, occasionally exceeding it, for approximately 32 hours. This suggests an extended period of overbought conditions. Concurrently, the price has been experiencing a steady decline, indicating a bearish trend. Traders should take note of the potential divergence between the stochastic indicator and the price movement, as it could indicate a weakening bullish momentum. It may be prudent to look for confirmation signals such as a bearish crossover or other technical indicators to support the likelihood of a sustained downtrend. Monitoring the price action closely will provide further insights for making informed trading decisions.
• DISCLAIMER: Please note that the above analysis is not an investment suggestion by “Capitalcore Ltd”. This post has been published only for educational purposes.