- August 8, 2023
- Posted by: Lewis Miller
- Category: Market News
Unraveling the EURJPY Stalemate: A Market Trend Analysis
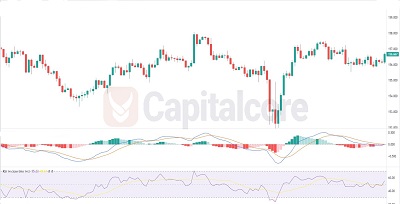
As we delve into the recent performance of the EURJPY pair, it’s clear that the market is currently locked in a consolidation phase. The pair’s oscillatory behavior is manifest in the form of sideways candle movements and neutrality in momentum indicators. Let’s explore this further and analyze what these technical patterns may imply for future price movements.
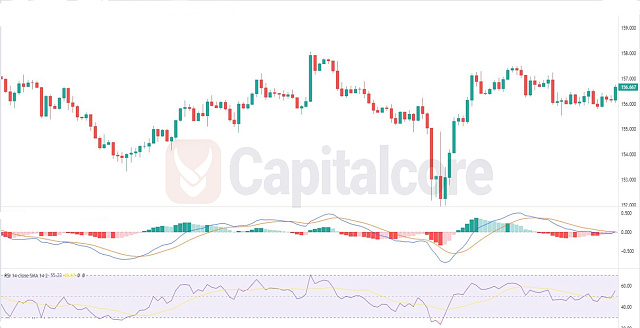
Chart Notes:
• Chart time-zone is UTC (+03:00)
• Candles’ time-frame is 4h.
EURJPY’s trading environment appears to be range-bound, with the price movement primarily sideways as indicated by the near-flat candle patterns. The RSI’s oscillation around the centerline reinforces this sentiment, showing neither strong buying nor selling momentum. The close proximity of the MACD and signal line, coupled with the MACD histogram hovering around zero, further suggests an equilibrium between buying and selling pressure. While this market condition presents certain trading opportunities, traders should exercise caution and look for decisive signals or events that could potentially spark a breakout from this consolidation phase. As always, combining these technical observations with fundamental analysis will provide a more holistic trading approach.
• DISCLAIMER: Please note that the above analysis is not an investment suggestion by “Capitalcore Ltd”. This post has been published only for educational purposes.