- August 22, 2023
- Posted by: Lewis Miller
- Category: Market News
RSI and Ichimoku Dynamics in EURJPY Analysis
In the context of EURJPY trading, an RSI reading around 70 suggests overbought conditions, while a gradually ascending green Ichimoku Cloud indicates bullish momentum. Balancing these signals is key for informed trading decisions.
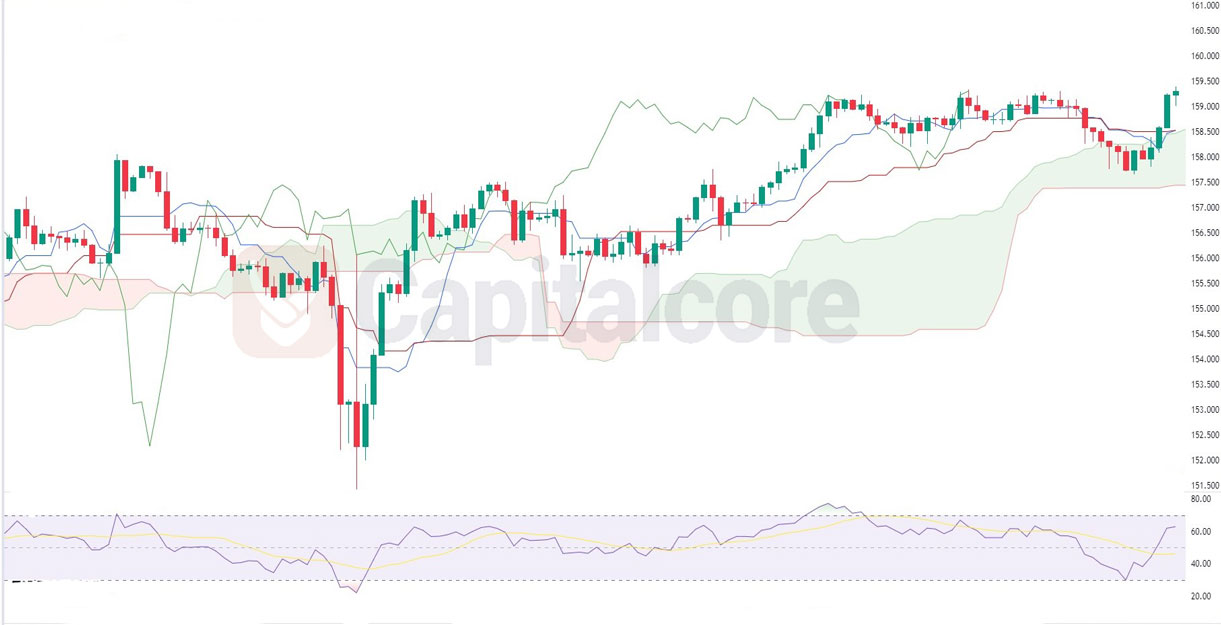
Chart Notes:
• Chart time-zone is UTC (+03:00)
• Candles’ time-frame is 4h.
In the dynamic realm of forex trading, the EURJPY currency pair has captured the attention of traders seeking opportunities within the Euro and Japanese Yen relationship. As we delve into the intricate world of technical analysis, our focus centers on two vital indicators: the Relative Strength Index (RSI) and the Ichimoku Cloud. The RSI, with its ability to signal potential overbought or oversold conditions, meets the steadfast Ichimoku Cloud, which paints a comprehensive picture of trend direction and support levels. Together, these indicators offer insights that can guide trading decisions, providing a balance between cautious precision and optimistic momentum. In this analysis, we navigate through their synergistic interplay to unearth potential trading strategies amidst this intricate dance of signals.
• DISCLAIMER: Please note that the above analysis is not an investment suggestion by “Capitalcore Ltd”. This post has been published only for educational purposes.