- August 25, 2023
- Posted by: Lewis Miller
- Category: Market News
Bearish Slowdown? EURJPY’s Revealing Indicators
In the realm of Forex trading, the dynamics between short-term and long-term indicators offer crucial insights for potential market shifts. Analyzing the EURJPY 4-hour chart reveals some noteworthy trends in momentum and pressure, which could hint at forthcoming movements. Let’s delve deeper into these specific indicators and interpret their implications for the currency pair.
![]()
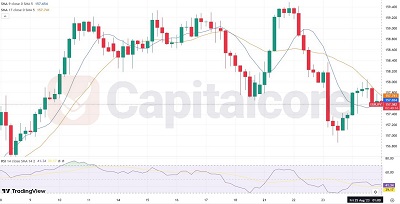
Chart Notes:
• Chart time-zone is UTC (+03:00)
• Candles’ time-frame is 4h.
In the EURJPY 4-hour chart, the short-term SMA is approaching the long-term SMA, indicating a potential easing of bearish momentum, although the price remains below the long-term SMA. The RSI at 41.34 and RSI-Based MA at 39.17 suggest modest selling pressure and weakening momentum. A break above the long-term SMA and RSI surpassing 50 could signal a bullish reversal. Traders should monitor these developments, as the pair may consolidate or experience a minor corrective bounce in the near term.
• DISCLAIMER: Please note that the above analysis is not an investment suggestion by “Capitalcore Ltd”. This post has been published only for educational purposes.