- August 30, 2023
- Posted by: capadmin
- Category: Market News
Bullish Signs in Technicals
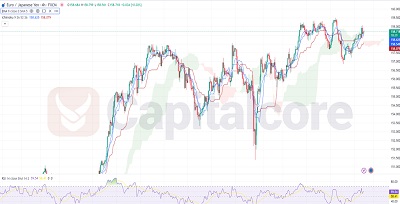
The EUR/JPY analysis reveals several key indicators. The RSI at 60% indicates a moderate bullish sentiment. In the Ichimoku context, the most recent cloud is green, implying a potential shift towards an uptrend. The candles are on the verge of exiting the cloud, potentially suggesting a bullish breakout.
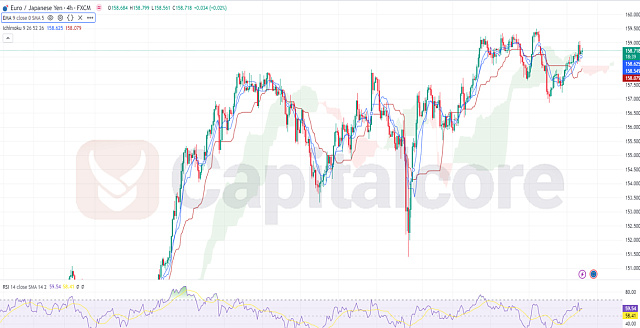
Chart Notes:
• Chart time-zone is UTC (+03:00)
• Candles’ time-frame is 4h.
Additionally, both the conversion line and base line are positioned below the candles, implying upward pressure. The crossover of the conversion line over the base line further supports a bullish outlook. Moreover, the moving average residing beneath the candles might signify a reinforcing bullish bias.
• DISCLAIMER: Please note that the above analysis is not an investment suggestion by “Capitalcore Ltd”. This post has been published only for educational purposes.