- July 21, 2023
- Posted by: Lewis Miller
- Category: Market News
MA and Ichimoku Point to Bullish Market
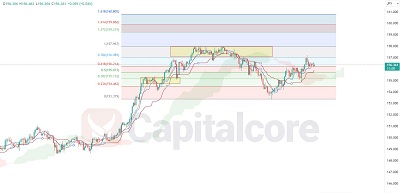
In our analysis, we are utilizing two technical indicators, the Moving Average (MA) and the Ichimoku Cloud, to identify a bullish trend in the market. The MA provides insights into the average price over a specific period, indicating the overall direction of the trend. When the MA is sloping upwards, it suggests a bullish bias. Additionally, the Ichimoku Cloud, which consists of multiple components such as the cloud, the Tenkan-sen, and the Kijun-sen, offers a comprehensive view of support and resistance levels, as well as potential trend reversals. By combining these indicators, we can assess the market’s bullish momentum and make informed trading decisions.
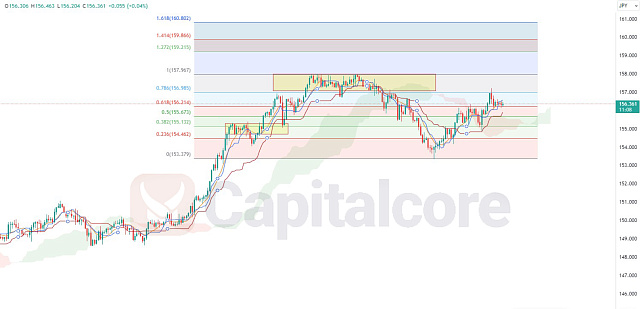
Chart Notes:
• Chart time-zone is UTC (+03:00)
• Candles’ time-frame is 4h.
The MA, positioned above the price candles, underscores the market’s positive sentiment, signifying an upward trajectory of the average price. Additionally, within the Ichimoku Cloud framework, the conversion line is observed below both the price candles and the baseline, reinforcing the bullish outlook by indicating a potential uptrend. Furthermore, the recent cloud’s green color further bolsters the bullish sentiment, suggesting an augmented presence of buying pressure. By synergistically utilizing these indicators, we can gain invaluable insights into the current bullish trend, facilitating informed trading decisions in line with the prevailing market dynamics. Furthermore, the Fibonacci analysis reveals an additional bullish signal as the price hits the 618 level, a key Fibonacci retracement level often associated with strong support and potential upward movement. By combining these technical indicators, we observe a confluence of bullish signals, reinforcing the positive outlook and supporting informed trading decisions.
• DISCLAIMER: Please note that the above analysis is not an investment suggestion by “Capitalcore Ltd”. This post has been published only for educational purposes.