- December 4, 2023
- Posted by: capadmin
- Category: Market News
Bearish Bollinger: EURUSD Faces Downward Pressure
The EURUSD pair, often referred to as the “fiber,” represents the relationship between two of the largest and most traded economies in the world, the Eurozone and the United States. This currency pair is renowned for its liquidity and tight spreads, making it a favorite among traders. The pair’s value is heavily influenced by the monetary policies of the European Central Bank (ECB) and the Federal Reserve (Fed), as well as the economic health of both regions.
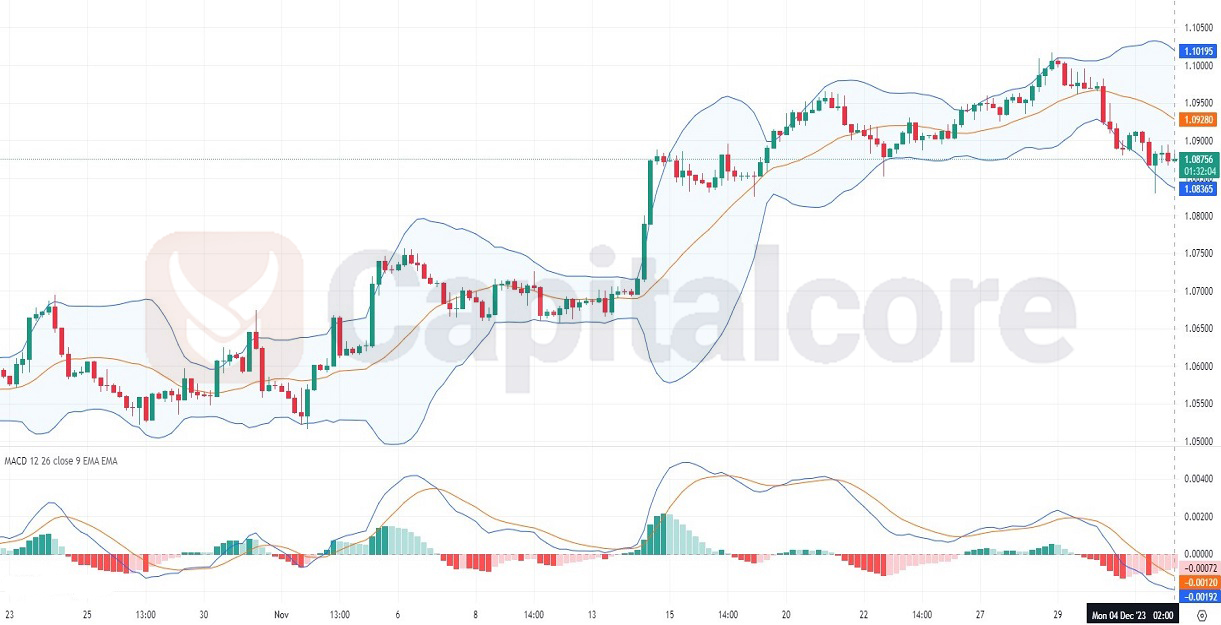
Chart Notes:
• Chart time-zone is UTC (+03:00)
• Candles’ time-frame is 4h.
The EURUSD H4 chart exhibits a weakening uptrend as indicated by the Bollinger Bands, with the price currently retreating toward the lower band. This suggests increased volatility and potential downward price pressure. The Moving Average Convergence Divergence (MACD) histogram is trending below the baseline, indicating bearish momentum. Additionally, the MACD line has crossed below the signal line, reinforcing the bearish outlook. The recent price movement has deviated below the 20-period moving average, further supporting the potential for a bearish continuation. However, the proximity of the price to the lower Bollinger Band may also suggest a possible oversold condition, which could lead to a short-term rebound.
• DISCLAIMER: Please note that the above analysis is not an investment suggestion by “Capitalcore Ltd”. This post has been published only for educational purposes.