- March 14, 2024
- Posted by: capadmin
- Category: Market News
EURUSD’s Momentum Test: MACD Versus Ichimoku
In this technical analysis, we evaluate the recent behavior of the EURUSD currency pair on a 4-hourly (H4) timeframe. The analysis takes into account the latest patterns and indicators, specifically focusing on the Ichimoku Cloud and MACD, to forecast potential market movements and identify trading opportunities.

Chart Notes:
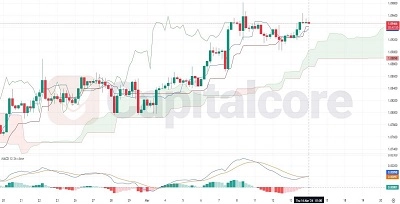
• Chart time-zone is UTC (+03:00)
• Candles’ time-frame is 4h.
The EURUSD pair on the 4H chart exhibits consolidation within the Ichimoku Cloud, suggesting a phase of indecision. The price is currently near the upper boundary of the Cloud, indicating possible resistance. The MACD is trending slightly above the signal line, yet the histogram reflects a decrease in momentum as it approaches the baseline, signifying a weakening uptrend. Observing the recent crossover of the MACD line above the signal line, traders might anticipate potential bullish momentum, although this is tempered by the flattening histogram. The proximity of the price to the Ichimoku Cloud’s upper edge may provide resistance, with a break above or below the Cloud to set the trend direction.
• DISCLAIMER: Please note that the above analysis is not an investment suggestion by “Capitalcore Ltd”. This post has been published only for educational purposes.