- December 13, 2023
- Posted by: capadmin
- Category: Market News
EURUSD: Bullish Breakthrough in Ichimoku Cloud
The EURUSD pair, known as the “Euro,” is a major currency pair that represents the exchange rate between the Euro and the U.S. Dollar. This significant pair reflects the economic relationship between the European Union and the United States and is a key barometer for global economic health. This technical analysis examines the current chart patterns and technical indicators to predict possible market directions.
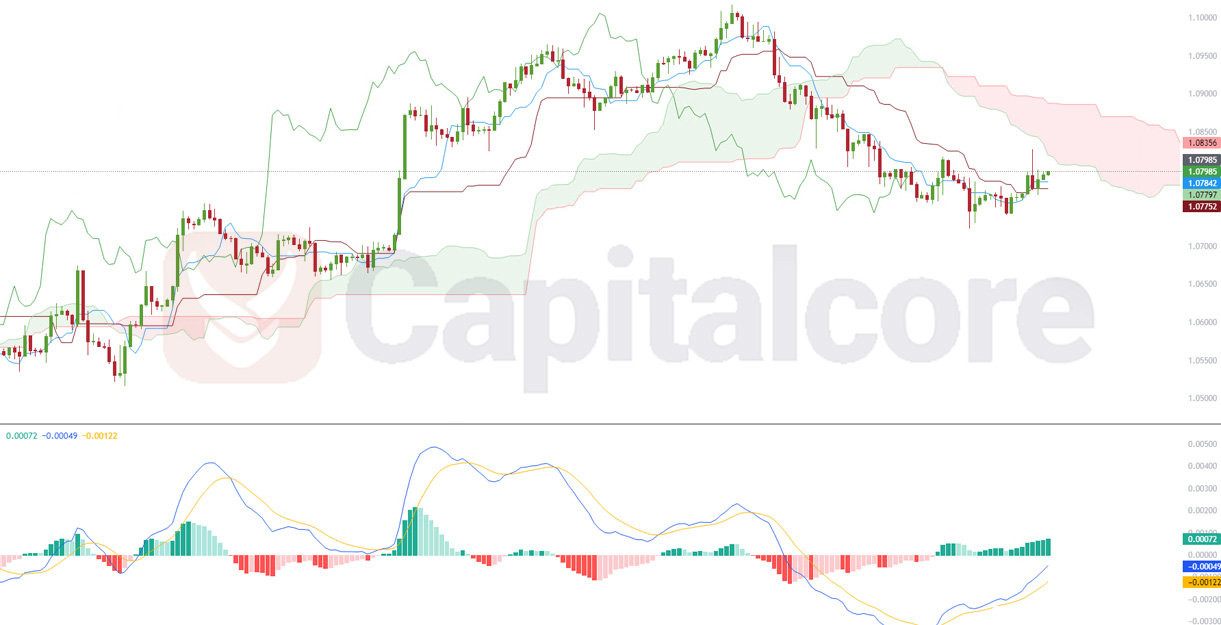
Chart Notes:
• Chart time-zone is UTC (+03:00)
• Candles’ time-frame is 4h.
The EURUSD chart displays a positive trend as the price has moved above the Ichimoku Cloud, indicating a bullish environment. The Tenkan-sen (blue line) has crossed above the Kijun-sen (red line), which is generally considered a bullish signal. Meanwhile, the Chikou Span (green line) is positioned above the price, reinforcing the bullish outlook. The MACD histogram has positive bars, suggesting growing bullish momentum, with the MACD line (blue) rising above the signal line (orange). The absence of the Relative Strength Index (RSI) from the visible chart means we must base our analysis on the price movement and the Ichimoku and MACD indications. Support is evident at around 1.07752, with resistance potentially forming near recent highs at 1.08356.
• DISCLAIMER: Please note that the above analysis is not an investment suggestion by “Capitalcore Ltd”. This post has been published only for educational purposes.