- October 25, 2023
- Posted by: capadmin
- Category: Market News

Ichimoku and RSI Perspective
The EURUSD pair presents an intriguing setup as we integrate insights from the Ichimoku Cloud and the RSI indicators. These combined tools offer a comprehensive view of the pair’s potential trajectory.
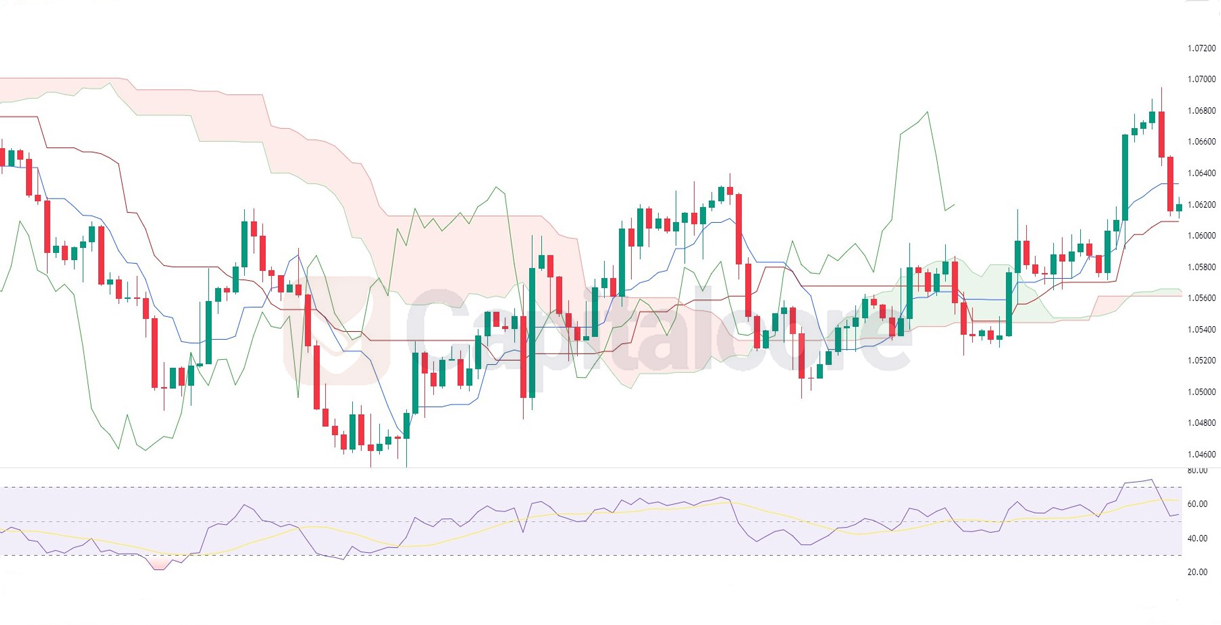
Chart Notes:
• Chart time-zone is UTC (+03:00)
• Candles’ time-frame is 4h.
The currency pair is currently navigating around the Ichimoku Cloud, hinting at an undecided market. A green cloud looming ahead suggests bullish sentiment, potentially indicating an upward movement. The Kijun and Tenkan lines seem to have recently experienced a bullish crossover, further reinforcing this positive outlook. Meanwhile, the RSI is hovering around the mid-level, not suggesting an overbought or oversold scenario. However, traders should be vigilant. A sustained move above the cloud, combined with a rising RSI, could confirm the bullish sentiment. Conversely, resistance from the cloud’s upper boundary and a declining RSI might signal bearish reversals.
• DISCLAIMER: Please note that the above analysis is not an investment suggestion by “Capitalcore Ltd”. This post has been published only for educational purposes.