- December 21, 2023
- Posted by: capadmin
- Category: Market News

Bullish Crossover in Gold Analysis
The recent price movement shows that the pair has been trading predominantly in the lower half of the Bollinger Bands, suggesting a bearish bias in the market. The downward trend is highlighted by the price frequently touching or breaching the lower band, signifying strong selling pressure during those periods.
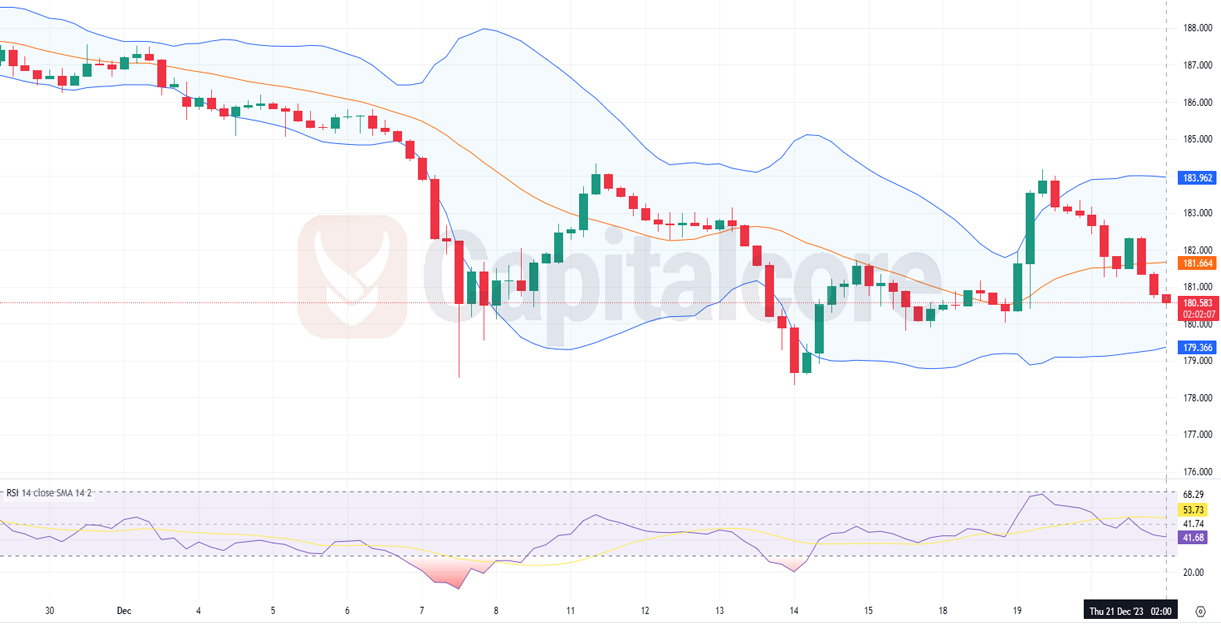
Chart Notes:
• Chart time-zone is UTC (+03:00)
• Candles’ time-frame is 4h.
While there has been some bullish retracement, the price has struggled to break above the middle band of the Bollinger Bands, which often acts as a resistance level in a downtrend. The Relative Strength Index (RSI) briefly entered the oversold territory, reflecting the intensity of the sell-off, but has since recovered, signaling a reduction in immediate selling momentum. However, the RSI has not yet crossed above the 50 threshold, which would indicate a shift to a bullish momentum. Additionally, the price has not breached the upper Bollinger Band, so the downtrend may still be in control. Traders would likely be looking for either a consolidation pattern or a bullish signal like a candle closing above the middle Bollinger Band to suggest a potential change in the trend direction.
• DISCLAIMER: Please note that the above analysis is not an investment suggestion by “Capitalcore Ltd”. This post has been published only for educational purposes.