- June 11, 2024
- Posted by: james w
- Category: Market News
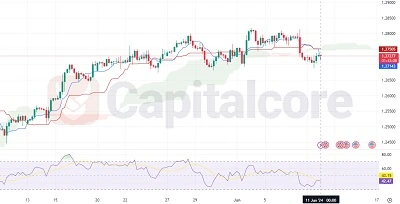
The GBP/USD H4 price chart has experienced a significant bearish wave, with the price line descending well below the Ichimoku cloud, indicating a strong downtrend. However, recent GBPUSD candlestick patterns on this pair’s price chart suggest a potential recovery. Notably, the formation of a Morning Star pattern, a powerful bullish reversal signal, hints at a possible upward momentum. This pattern is often seen as a reliable indicator that the bears are losing control, and the bulls may take over, making it a crucial point for traders looking for a trend reversal, as predicted by price action analysis on this pair.

Chart Notes:
• Chart time-zone is UTC (+03:00)
• Candles’ time-frame is 4h.
Additionally, the Relative Strength Index (RSI) on the H4 price chart of the pair is showing positive divergence, reinforcing the recovery potential for GBP/USD. This divergence occurs when the RSI indicator forms higher lows while the price forms lower lows, suggesting that the bearish momentum is weakening. For clients seeking GBP/USD technical analysis and price prediction, these technical signals provide valuable insights. As the pair may be gearing up for a bullish reversal, traders should monitor these indicators closely, as well as the price behavior on the pair, considering the possibility of a strategic entry point in anticipation of a rebound.