- November 17, 2023
- Posted by: capadmin
- Category: Market News
Bullish Trends in Technical Analysis
The chart shows the EUR/USD exchange rate fluctuating over time. Recently, there has been a noticeable uptrend with the price moving above the 1.0900 level, indicating a strengthening of the Euro against the US Dollar. The upper red-shaded area may represent an overbought zone in a technical indicator, suggesting the currency pair might be reaching levels where a reversal could be expected.
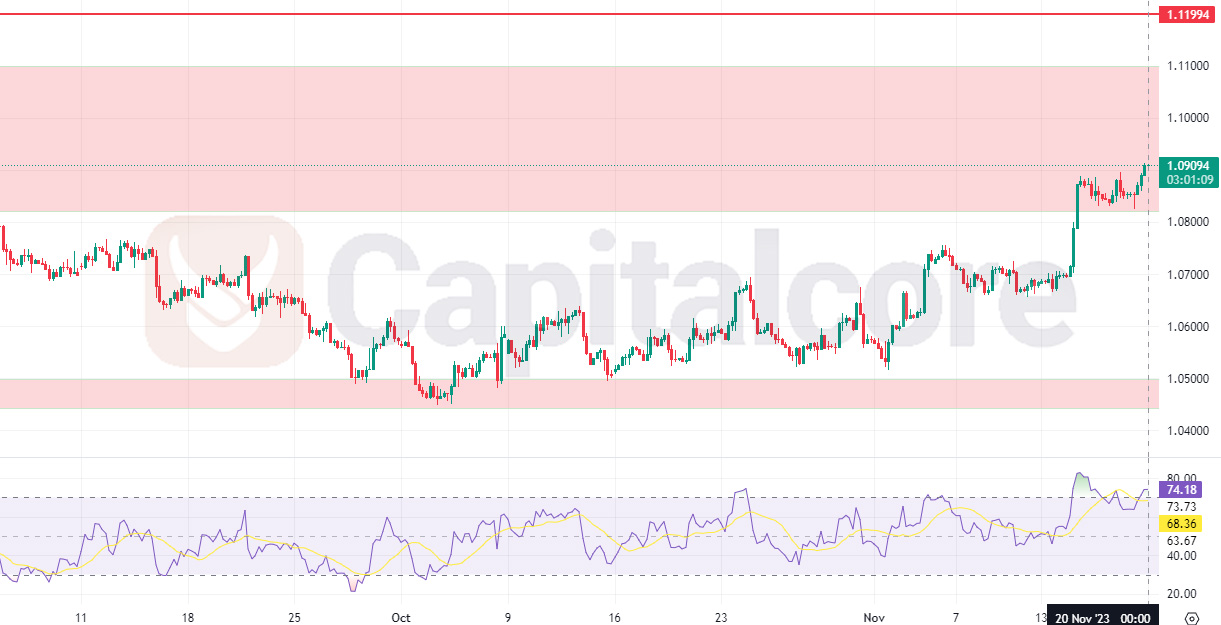
Chart Notes:
• Chart time-zone is UTC (+03:00)
• Candles’ time-frame is 4h.
In the initial phase of the chart, the EUR/USD pair exhibited a consolidation pattern, reflecting uncertainty among market participants. This sideways movement, characterized by alternating small bullish and bearish candlesticks, suggests a period of equilibrium where supply and demand forces are evenly matched. However, this balance was disrupted, leading to a price decline. This downtrend could be attributed to a variety of factors such as disappointing economic reports from the Eurozone, escalating geopolitical tensions, or diverging monetary policies, with the European Central Bank potentially maintaining a more accommodative stance compared to a hawkish Federal Reserve. This phase highlights the importance of inter-market analysis where currency movements often reflect broader economic and political trends.
As the chart progresses, the narrative changes with the EUR/USD pair embarking on a clear uptrend. Technical analysts would note the formation of higher highs and higher lows, a classic indication of bullish sentiment taking hold. The momentum is visually represented by larger green candlesticks, implying a strong buying interest. The ascent past the psychological barrier of 1.0900 could have been propelled by several factors. One possibility is improved economic indicators or positive news flow from the Eurozone, leading investors to reassess the currency’s valuation. Additionally, the weakening of the USD in this period could be due to softer economic data or changes in fiscal policy that diminish investor confidence in the dollar. The RSI nearing overbought levels indicates that while the market is heating up, the trend’s strength is such that it could sustain higher prices without immediate reversal.
Finally, while technical patterns are critical, they form only part of the story. Fundamental analysis offers insight into the underlying economic conditions that can drive currency movements. Interest rate differentials, for example, are a key driver of forex markets, as higher rates often attract capital flows seeking better returns. Economic growth rates, reflected in GDP reports, also influence currency strength, with faster-growing economies typically seeing stronger currencies. Additionally, political stability can greatly impact investor confidence and currency strength. Thus, a comprehensive analysis would consider upcoming economic reports, central bank statements, and political news, alongside technical indicators like moving averages and chart patterns like triangles or head and shoulders. This multifaceted approach helps traders gauge the market sentiment and anticipate potential shifts in the EUR/USD trajectory.
• DISCLAIMER: Please note that the above analysis is not an investment suggestion by “Capitalcore Ltd”. This post has been published only for educational purposes.