- January 17, 2024
- Posted by: capadmin
- Category: Market News
Navigating the Shift: GBPCAD’s Parabolic SAR and MACD Suggest a Change in Trend
The GBPCAD pair has demonstrated a clear downtrend over the selected time frame, as evidenced by the sequence of lower highs and lower lows, which is indicative of bearish momentum. The price is currently hovering around 1.71159, having experienced some volatility, as shown by the length of the candlestick wicks. The Moving Average (dotted lines) suggests a potential trend reversal or pullback, as the price has recently crossed above it. This bullish signal, however, needs further confirmation as the price remains below the key resistance level at 1.72043.
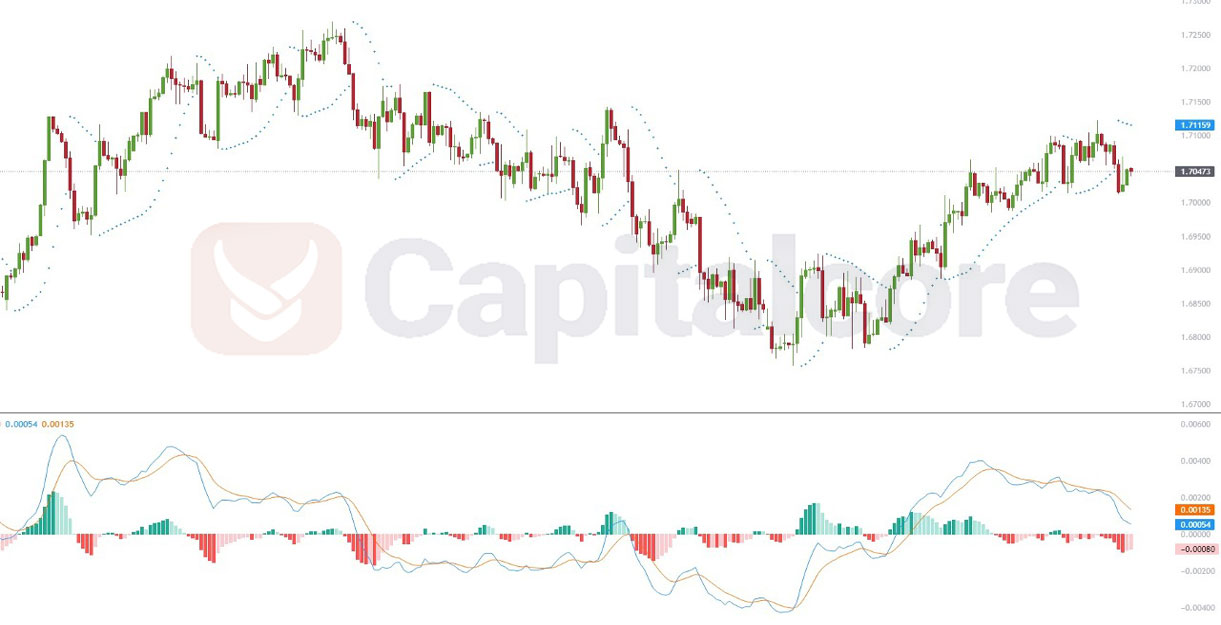
Chart Notes:
• Chart time-zone is UTC (+03:00)
• Candles’ time-frame is 4h.
The MACD (Moving Average Convergence Divergence) indicator, presented below the price chart, shows a bearish crossover, with the MACD line (blue) crossing below the signal line (orange), which typically suggests downward momentum. However, the histogram appears to be decreasing in negative momentum, which could signal the slowing down of the bearish trend. Traders might be cautious, looking for additional signals before confirming a trend reversal. The near-zero line crossover of the MACD may be watched closely for indications of a stronger bullish reversal if it materializes.
The Parabolic SAR indicator on the GBPCAD chart has transitioned below the price candles, suggesting a potential bullish trend reversal. This change could be interpreted by traders as a signal to consider initiating long positions, with the SAR dots now serving as dynamic support levels. The proximity of the dots to the price also reflects the current volatility and may be used for setting trailing stop losses during this potential uptrend phase.
• DISCLAIMER: Please note that the above analysis is not an investment suggestion by “Capitalcore Ltd”. This post has been published only for educational purposes.