- January 29, 2024
- Posted by: capadmin
- Category: Market News
GBPCHF: Interpreting MACD and RSI Fluctuations
The GBPCHF pair represents the exchange rate between the British Pound and the Swiss Franc, two of Europe’s most significant currencies. This pair is often affected by changes in European economic policies, geopolitical events, and differences in the economic growth of the UK and Switzerland.
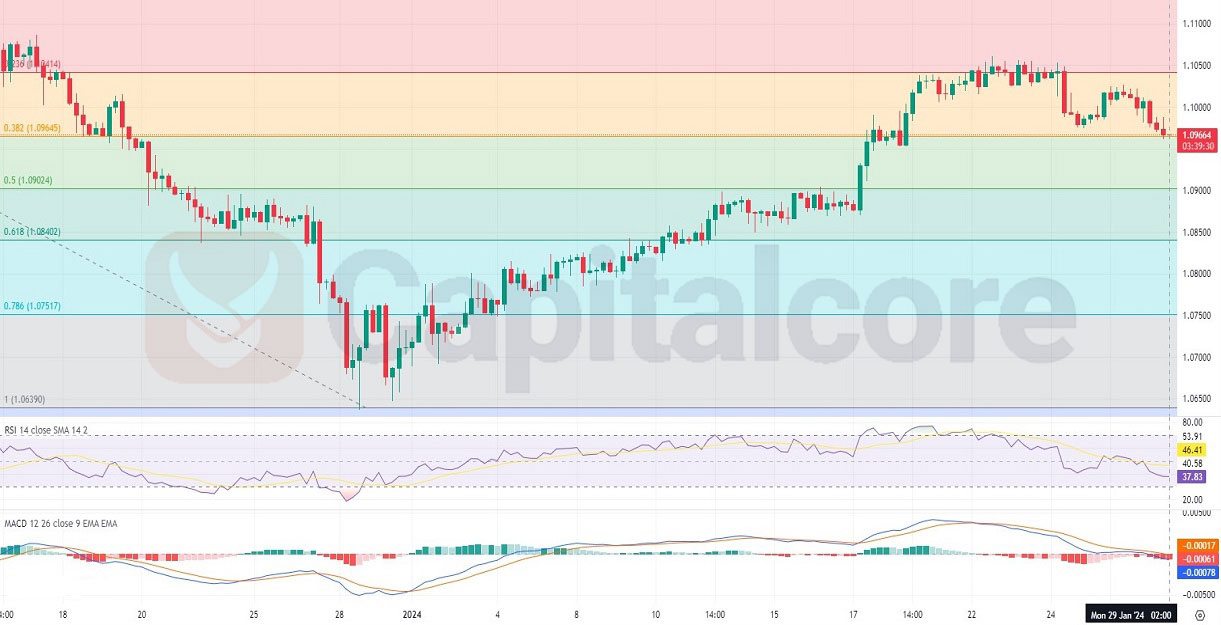
Chart Notes:
• Chart time-zone is UTC (+03:00)
• Candles’ time-frame is 4h.
On the H4 chart for GBPCHF, the price has recently retreated from a high near the 1.1165 level, now testing the 0.5 Fibonacci retracement level at 1.0905, which is acting as a crucial support zone. The RSI is trending downwards and is currently around 46, suggesting a loss of bullish momentum and moving towards neutral territory. The MACD histogram is narrowing, and the MACD line is converging with the signal line, indicating a weakening of the current trend and potential for a trend reversal if the bearish momentum continues. With the price below the 0.382 Fibonacci level at 1.0966, if the support at 1.0905 does not hold, we could see further downside towards the 0.618 level at 1.0843. Conversely, a bounce from this support level could lead to a retest of the 0.382 level. Therefore, traders should monitor these levels for potential entry or exit signals, considering the current indecisive market sentiment reflected by the technical indicators.
• DISCLAIMER: Please note that the above analysis is not an investment suggestion by “Capitalcore Ltd”. This post has been published only for educational purposes.